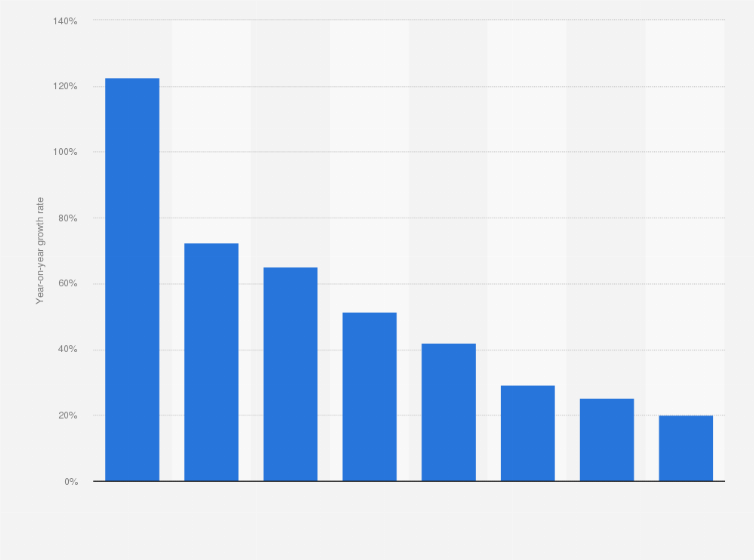
The graph shows the year-on-year change in programmatic digital display advertising spending in China from 2014 to 2018 as well as a forecast until 2021. The source projected the spending to grow by 25.2 percent in 2020.
Change in programmatic digital display advertising spending in China from 2014 to 2018 with forecasts until 2021
Adjust the presentation of the statistic and data points.
Share the statistic on social media channels or embed the statistic in your
website using "Embed Code", where available.
Cite this statistic and select one of the following formats: APA, Chicago, Harvard, MLA & Bluebook.
Print the statistic including description and metadata.
Chart type
Change in programmatic digital display advertising spending in China from 2014 to 2018 with forecasts until 2021
Share this statistic
You have no right to use this feature.
Make sure to contact us if you are interested in scientific citation.
You can upgrade your account to enable this functionality for all statistics.
This feature is not available with your current account.Request access
Digital display ads transacted via an API, including everything from publisher-erected APIs to more standardized RTB technology; includes ads on e-commerce websites like Alibaba properties; includes advertising that appears on desktop/laptop computers, mobile phones, rich media, sponsorship, video and other internet-connected devices.
Learn more about how Statista can support your business.
Website (theegg.com). (February 2, 2021). Change in programmatic digital display advertising spending in China from 2014 to 2018 with forecasts until 2021 [Graph]. In Statista. Retrieved April 25, 2025, from https://www.statista.com/statistics/510271/programmatic-digital-display-ad-spend-growth-china/
Website (theegg.com). "Change in programmatic digital display advertising spending in China from 2014 to 2018 with forecasts until 2021." Chart. February 2, 2021. Statista. Accessed April 25, 2025. https://www.statista.com/statistics/510271/programmatic-digital-display-ad-spend-growth-china/
Website (theegg.com). (2021). Change in programmatic digital display advertising spending in China from 2014 to 2018 with forecasts until 2021. Statista. Statista Inc.. Accessed: April 25, 2025. https://www.statista.com/statistics/510271/programmatic-digital-display-ad-spend-growth-china/
Website (theegg.com). "Change in Programmatic Digital Display Advertising Spending in China from 2014 to 2018 with Forecasts until 2021." Statista, Statista Inc., 2 Feb 2021, https://www.statista.com/statistics/510271/programmatic-digital-display-ad-spend-growth-china/
Website (theegg.com), Change in programmatic digital display advertising spending in China from 2014 to 2018 with forecasts until 2021 Statista, https://www.statista.com/statistics/510271/programmatic-digital-display-ad-spend-growth-china/ (last visited April 25, 2025)
Change in programmatic digital display advertising spending in China from 2014 to 2018 with forecasts until 2021 [Graph], Website (theegg.com), February 2, 2021. [Online]. Available: https://www.statista.com/statistics/510271/programmatic-digital-display-ad-spend-growth-china/
Profit from additional features with an Employee Account
Please create an employee account to be able to mark statistics as favorites.
Then you can access your favorite statistics via the star in the header.
Profit from the additional features of your individual account
Currently, you are using a shared account. To use individual functions (e.g., mark statistics as favourites, set
statistic alerts) please log in with your personal account.
If you are an admin, please authenticate by logging in again.