Slovenia's number of buses and coaches fluctuated between 2,000 and 3,000 in the last 30-year period. In 2019, the bus and coach vehicle stock amounted to 2,900 units, a peak value for this period recorded here. In 2021, this value was recorded at 2,600 in 2021.
Number of registered buses and coaches in Slovenia between 1990 and 2021 (in 1,000)
Basic Account
Get to know the platform
You only have access to basic statistics.
This statistic is not included in your account.
Starter Account
The ideal entry-level account for individual users
- Instant access to 1m statistics
- Download in XLS, PDF & PNG format
- Detailed references
$199 USD / Month *
Professional Account
Full access
Business Solutions including all features.
* Prices do not include sales tax.
Other statistics that may interest you Transport industry in Slovenia
Freight transport
8
- Basic Statistic Slovenia: tonne-kilometers of freight transported by rail 2008-2022
- Basic Statistic Tonne-kilometers of freight transported by road in Slovenia 2008-2022
- Basic Statistic Total tonne-kilometers of freight transported in Slovenia 2008-2022
- Premium Statistic Freight rail transport revenue in Slovenia 2010-2022
- Premium Statistic Industry revenue of “freight transport by road“ in Slovenia 2012-2025
- Premium Statistic Forecast: inland freight water transport revenue Slovenia 2008-2018
- Premium Statistic Industry revenue of “sea and coastal freight water transport“ in Slovenia 2012-2025
- Premium Statistic Industry revenue of “freight air transport and space transport“ in Slovenia 2012-2025
Passenger transport
5
- Basic Statistic Passengers transported by rail in Slovenia 2009-2022
- Premium Statistic Passengers transported by private car in Slovenia 2001-2010
- Premium Statistic Passengers transported by coach and bus in Slovenia 2001-2010
- Premium Statistic Total passenger road transport in Slovenia 2001-2010
- Premium Statistic Slovenia: modal split of passenger transport on land in 2021
Transport infrastructure investment
6
- Basic Statistic Investment in rail transport infrastructure in Slovenia 2004-2019
- Basic Statistic Investment in road transport infrastructure in Slovenia 2004-2018
- Basic Statistic Total investment in inland transport infrastructure in Slovenia 2004-2019
- Basic Statistic Investment in sea port infrastructure in Slovenia 2004-2020
- Basic Statistic Investment in airport infrastructure in Slovenia 2004-2019
- Basic Statistic Slovenia: share of GDP invested in inland transport infrastructure 2008-2021
Economic data
4
- Premium Statistic Number of employees in the transport industry in Slovenia 2020, by sector
- Premium Statistic Slovenia: number of enterprises in the transport sector in 2020, by mode
- Premium Statistic Turnover in the transport industry in Slovenia 2020, by sector
- Premium Statistic Transport final consumption expenditure in Slovenia in 2021, by type
Road vehicle market
5
- Premium Statistic Slovenia: number of new passenger car registrations from 2005 to 2022
- Premium Statistic Slovenia: number of cars per 1,000 inhabitants 1990-2021
- Premium Statistic Registered passenger cars in Slovenia 1990-2021
- Premium Statistic 
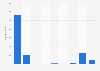
Slovenia: number of registered buses and coaches from 1990 to 2021
- Premium Statistic Slovenia: number of registered goods vehicles from 1990 to 2020
Road and rail networks
6
- Premium Statistic Combined length of motorways in Slovenia 1990-2021
- Premium Statistic Slovenia: length of road network in 2021 by road type
- Basic Statistic Number of road deaths in Slovenia 2009-2022
- Basic Statistic Number of non-fatal road traffic injuries in Slovenia 2009-2022
- Premium Statistic Length of railway lines in use in Slovenia from 1990 to 2019
- Premium Statistic Slovenia: number of locomotives and railcars from 1990 to 2019
Further related statistics
18
- Denmark: number of registered buses and coaches from 1990 to 2018
- United Kingdom (UK): number of registered buses and coaches from 1990 to 2016
- Number of registered buses and coaches in Montenegro 2011-2016
- Greece: number of registered buses and coaches from 1990 to 2016
- Number of registered buses and coaches in North Macedonia 1990-2016
- Netherlands: number of registered buses and coaches from 1990 to 2016
- Number of registered buses and coaches in Iceland 1990-2021
- Number of used registered buses in Poland 2022-2023, by type
- Number of registered buses and coaches in Poland 1990-2021
- Stock of registered buses and coaches in Norway 1990-2018
- Romania: number of registered buses and coaches from 1990 to 2021
- Europe (EU-28): number of registered buses and coaches from 1990 to 2016
- Sweden: number of registered buses and coaches from 1990 to 2017
- Germany: number of registered buses and coaches 1990-2017
- Number of new registered buses in Poland 2022-2023, by producer
- Use of public transport in France 2017, by gender
- Bus fatalities in traffic accidents Spain 2011-2018
- Industry revenue of “school and employee bus transportation“ in Illinois 2012-2024
Further Content: You might find this interesting as well
Statistics
- Denmark: number of registered buses and coaches from 1990 to 2018
- United Kingdom (UK): number of registered buses and coaches from 1990 to 2016
- Number of registered buses and coaches in Montenegro 2011-2016
- Greece: number of registered buses and coaches from 1990 to 2016
- Number of registered buses and coaches in North Macedonia 1990-2016
- Netherlands: number of registered buses and coaches from 1990 to 2016
- Number of registered buses and coaches in Iceland 1990-2021
- Number of used registered buses in Poland 2022-2023, by type
- Number of registered buses and coaches in Poland 1990-2021
- Stock of registered buses and coaches in Norway 1990-2018
- Romania: number of registered buses and coaches from 1990 to 2021
- Europe (EU-28): number of registered buses and coaches from 1990 to 2016
- Sweden: number of registered buses and coaches from 1990 to 2017
- Germany: number of registered buses and coaches 1990-2017
- Number of new registered buses in Poland 2022-2023, by producer
- Use of public transport in France 2017, by gender
- Bus fatalities in traffic accidents Spain 2011-2018
- Industry revenue of “school and employee bus transportation“ in Illinois 2012-2024
European Commission. (September 20, 2023). Number of registered buses and coaches in Slovenia between 1990 and 2021 (in 1,000) [Graph]. In Statista. Retrieved May 13, 2024, from https://www.statista.com/statistics/452610/slovenia-number-of-registered-buses-and-coaches/
European Commission. "Number of registered buses and coaches in Slovenia between 1990 and 2021 (in 1,000)." Chart. September 20, 2023. Statista. Accessed May 13, 2024. https://www.statista.com/statistics/452610/slovenia-number-of-registered-buses-and-coaches/
European Commission. (2023). Number of registered buses and coaches in Slovenia between 1990 and 2021 (in 1,000). Statista. Statista Inc.. Accessed: May 13, 2024. https://www.statista.com/statistics/452610/slovenia-number-of-registered-buses-and-coaches/
European Commission. "Number of Registered Buses and Coaches in Slovenia between 1990 and 2021 (in 1,000)." Statista, Statista Inc., 20 Sep 2023, https://www.statista.com/statistics/452610/slovenia-number-of-registered-buses-and-coaches/
European Commission, Number of registered buses and coaches in Slovenia between 1990 and 2021 (in 1,000) Statista, https://www.statista.com/statistics/452610/slovenia-number-of-registered-buses-and-coaches/ (last visited May 13, 2024)
Number of registered buses and coaches in Slovenia between 1990 and 2021 (in 1,000) [Graph], European Commission, September 20, 2023. [Online]. Available: https://www.statista.com/statistics/452610/slovenia-number-of-registered-buses-and-coaches/