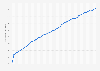
This statistic shows the distribution of households in the United States from 1990 to 2022, by type. In 2022, about 35.77 percent of all households in the United States were one person households.
Percentage of households in the U.S. from 1990 to 2022, by type
Profit from the additional features of your individual account
Currently, you are using a shared account. To use individual functions (e.g., mark statistics as favourites, set
statistic alerts) please log in with your personal account.
If you are an admin, please authenticate by logging in again.
Learn more about how Statista can support your business.
US Census Bureau. (November 10, 2022). Percentage of households in the U.S. from 1990 to 2022, by type [Graph]. In Statista. Retrieved July 22, 2024, from https://www.statista.com/statistics/242244/percentage-of-us-households-by-type/
US Census Bureau. "Percentage of households in the U.S. from 1990 to 2022, by type." Chart. November 10, 2022. Statista. Accessed July 22, 2024. https://www.statista.com/statistics/242244/percentage-of-us-households-by-type/
US Census Bureau. (2022). Percentage of households in the U.S. from 1990 to 2022, by type. Statista. Statista Inc.. Accessed: July 22, 2024. https://www.statista.com/statistics/242244/percentage-of-us-households-by-type/
US Census Bureau. "Percentage of Households in The U.S. from 1990 to 2022, by Type." Statista, Statista Inc., 10 Nov 2022, https://www.statista.com/statistics/242244/percentage-of-us-households-by-type/
US Census Bureau, Percentage of households in the U.S. from 1990 to 2022, by type Statista, https://www.statista.com/statistics/242244/percentage-of-us-households-by-type/ (last visited July 22, 2024)
Percentage of households in the U.S. from 1990 to 2022, by type [Graph], US Census Bureau, November 10, 2022. [Online]. Available: https://www.statista.com/statistics/242244/percentage-of-us-households-by-type/