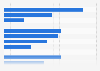
As of 2022, the number of installed professional service robots has increased in nearly all the application areas. Transportation and logistic robots were the most installed service robots from 2021 to 2022, with about
**
Log in or register to access precise data.
thousand installed robots by the latest year, leading in number and increase rate.
Adjust the presentation of the statistic and data points.
Share the statistic on social media channels or embed the statistic in your
website using "Embed Code", where available.
Cite this statistic and select one of the following formats: APA, Chicago, Harvard, MLA & Bluebook.
Print the statistic including description and metadata.
Chart type
Number of professional service robots installed worldwide from 2021 to 2022, by application area
Share this statistic
You have no right to use this feature.
Make sure to contact us if you are interested in scientific citation.
You can upgrade your account to enable this functionality for all statistics.
This feature is not available with your current account.Request access
Learn more about how Statista can support your business.
Stanford University. (April 15, 2024). Number of professional service robots installed worldwide from 2021 to 2022, by application area (in thousands) [Graph]. In Statista. Retrieved August 25, 2025, from https://www.statista.com/statistics/1472868/installed-professional-service-robots-worldwide-by-application-area/
Stanford University. "Number of professional service robots installed worldwide from 2021 to 2022, by application area (in thousands)." Chart. April 15, 2024. Statista. Accessed August 25, 2025. https://www.statista.com/statistics/1472868/installed-professional-service-robots-worldwide-by-application-area/
Stanford University. (2024). Number of professional service robots installed worldwide from 2021 to 2022, by application area (in thousands). Statista. Statista Inc.. Accessed: August 25, 2025. https://www.statista.com/statistics/1472868/installed-professional-service-robots-worldwide-by-application-area/
Stanford University. "Number of Professional Service Robots Installed Worldwide from 2021 to 2022, by Application Area (in Thousands)." Statista, Statista Inc., 15 Apr 2024, https://www.statista.com/statistics/1472868/installed-professional-service-robots-worldwide-by-application-area/
Stanford University, Number of professional service robots installed worldwide from 2021 to 2022, by application area (in thousands) Statista, https://www.statista.com/statistics/1472868/installed-professional-service-robots-worldwide-by-application-area/ (last visited August 25, 2025)
Number of professional service robots installed worldwide from 2021 to 2022, by application area (in thousands) [Graph], Stanford University, April 15, 2024. [Online]. Available: https://www.statista.com/statistics/1472868/installed-professional-service-robots-worldwide-by-application-area/
Advertisement
Profit from additional features with an Employee Account
Please create an employee account to be able to mark statistics as favorites.
Then you can access your favorite statistics via the star in the header.
Profit from the additional features of your individual account
Currently, you are using a shared account. To use individual functions (e.g., mark statistics as favourites, set
statistic alerts) please log in with your personal account.
If you are an admin, please authenticate by logging in again.