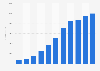
Video streaming apps, particularly short-formed video apps, have secured most of the user screen time in China. In December 2024, Chinese mobile users spent an average of three hours on short video apps per day, 16 minutes less than the previous year. In comparison, daily app usage time on instant messaging apps averaged 1.3 hours.
Average daily time spent on mobile apps by active users in China in December 2024, by selected app category
(in minutes)
Adjust the presentation of the statistic and data points.
Share the statistic on social media channels or embed the statistic in your
website using "Embed Code", where available.
Cite this statistic and select one of the following formats: APA, Chicago, Harvard, MLA & Bluebook.
Print the statistic including description and metadata.
Chart type
Average daily time spent on mobile apps by active users in China in December 2024, by selected app category
Share this statistic
You have no right to use this feature.
Make sure to contact us if you are interested in scientific citation.
You can upgrade your account to enable this functionality for all statistics.
This feature is not available with your current account.Request access
among active users; among major app categories based on monthly active user number
Supplementary notes
According to the source, the figures were based on the data collected by MoonFox iAPP. The daily mobile app usage includes tablet data. The industry metrics may vary.
Statista has been my savior on several occasions.
The site is easy to maneuver and the data is in a format that can
go right into a report or presentation.
Learn more about how Statista can support your business.
Moonfox Data. (January 29, 2025). Average daily time spent on mobile apps by active users in China in December 2024, by selected app category (in minutes) [Graph]. In Statista. Retrieved May 11, 2025, from https://www.statista.com/statistics/1090392/china-daily-mobile-app-usage-by-category/
Moonfox Data. "Average daily time spent on mobile apps by active users in China in December 2024, by selected app category (in minutes)." Chart. January 29, 2025. Statista. Accessed May 11, 2025. https://www.statista.com/statistics/1090392/china-daily-mobile-app-usage-by-category/
Moonfox Data. (2025). Average daily time spent on mobile apps by active users in China in December 2024, by selected app category (in minutes). Statista. Statista Inc.. Accessed: May 11, 2025. https://www.statista.com/statistics/1090392/china-daily-mobile-app-usage-by-category/
Moonfox Data. "Average Daily Time Spent on Mobile Apps by Active Users in China in December 2024, by Selected App Category (in Minutes)." Statista, Statista Inc., 29 Jan 2025, https://www.statista.com/statistics/1090392/china-daily-mobile-app-usage-by-category/
Moonfox Data, Average daily time spent on mobile apps by active users in China in December 2024, by selected app category (in minutes) Statista, https://www.statista.com/statistics/1090392/china-daily-mobile-app-usage-by-category/ (last visited May 11, 2025)
Average daily time spent on mobile apps by active users in China in December 2024, by selected app category (in minutes) [Graph], Moonfox Data, January 29, 2025. [Online]. Available: https://www.statista.com/statistics/1090392/china-daily-mobile-app-usage-by-category/
Profit from additional features with an Employee Account
Please create an employee account to be able to mark statistics as favorites.
Then you can access your favorite statistics via the star in the header.
Profit from the additional features of your individual account
Currently, you are using a shared account. To use individual functions (e.g., mark statistics as favourites, set
statistic alerts) please log in with your personal account.
If you are an admin, please authenticate by logging in again.