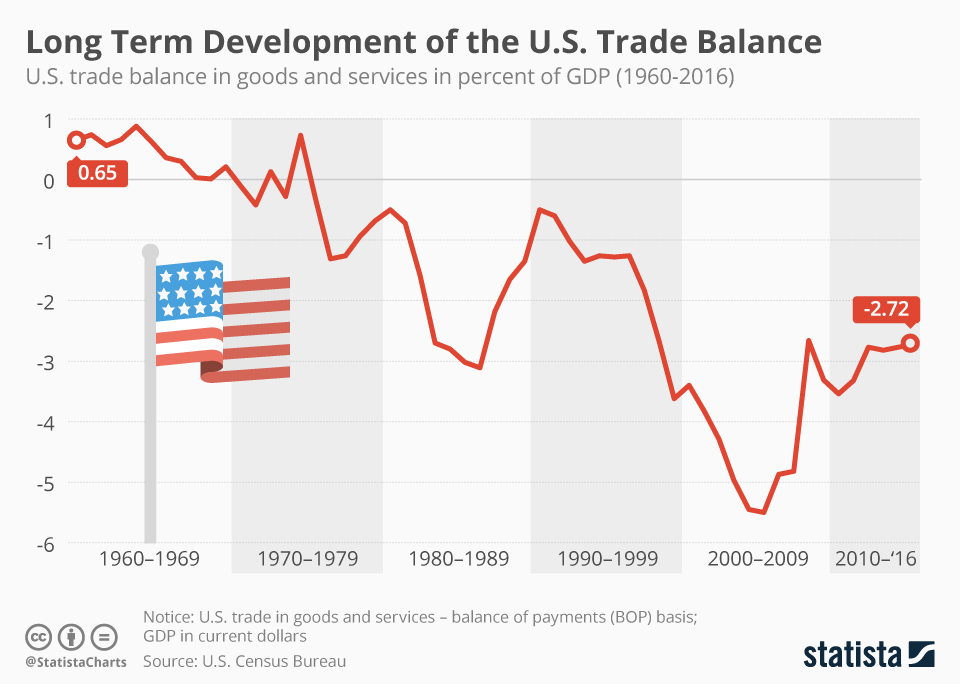
The trade balance in 2016 was negative, just as in previous years. The last positive trade balance occurred in 1975. Since then U.S. imports have grown faster than exports. While the U.S. world export share stood at 14.6 percent in 1965, it fell to just 10.9 percent in 1984.
At the beginning of the nineties the trade deficit started to grow growing rapidly. Reasons for this were, among other things, the fact that the U.S. economy grew faster than the economies of its trading partners, which led to a faster development of domestic consumer demand than foreign consumer demand.
In addition, the real exchange rate increased, which led to a revaluation of American goods. Another point was that Americans seemingly preferred to buy foreign products.
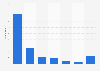
All these factors led to an increasing trade deficit. The Statista infographic shows the difference between exports and imports measured as a share of GDP between 1960 and 2016. While some try to make out that the U.S. trade deficit is the machination of foreign powers its root cause can also be traced to developments in America .
Long Term Development of the U.S. Trade Balance
U.S. Trade Balance

Description
This chart shows the U.S. trade balance in goods and services in percent of GDP (1960-2016)