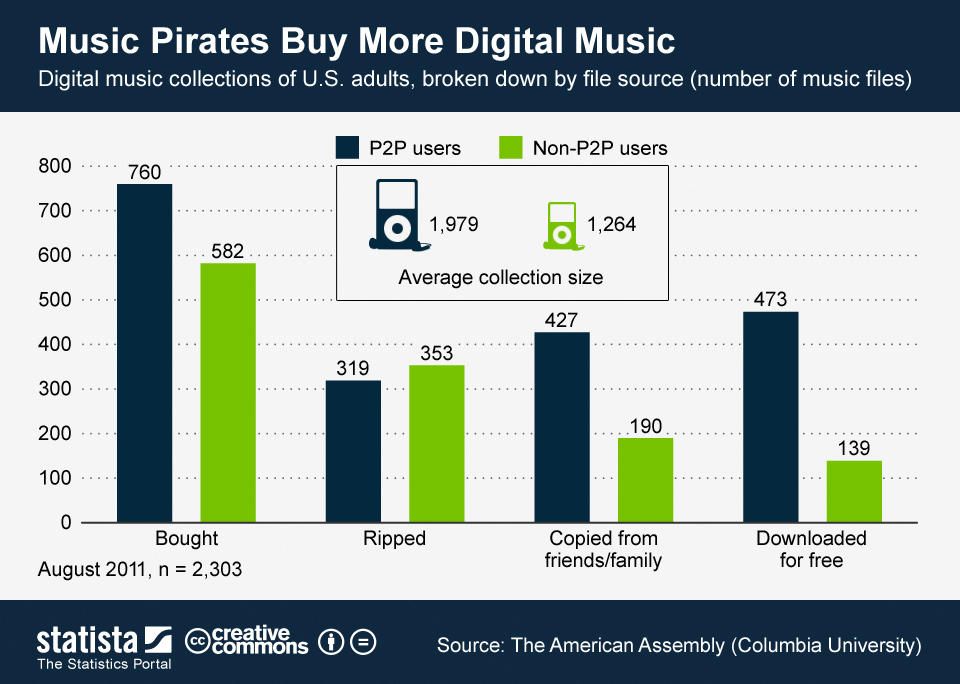
Between April 2019 and March 2020, the trading income of the Science Museum Group (SMG) in England decreased slightly over the previous year. In 2018/2019, SMG museums generated roughly 2.5 million British pounds through trading activities (such as retail sales and corporate hire). In 2019/2020, the trading income went down to about 2.4 million British pounds.
Annual trading income of the Science Museum Group (SMG) in England from financial year 2008 to 2020
(in 1,000 GBP)
Adjust the presentation of the statistic and data points.
Share the statistic on social media channels or embed the statistic in your
website using "Embed Code", where available.
Cite this statistic and select one of the following formats: APA, Chicago, Harvard, MLA & Bluebook.
Print the statistic including description and metadata.
Chart type
Annual trading income of the Science Museum Group (SMG) in England from financial year 2008 to 2020
Share this statistic
You have no right to use this feature.
Make sure to contact us if you are interested in scientific citation.
You can upgrade your account to enable this functionality for all statistics.
This feature is not available with your current account.Request access
Statista has been my savior on several occasions.
The site is easy to maneuver and the data is in a format that can
go right into a report or presentation.
Learn more about how Statista can support your business.
Department for Digital, Culture, Media and Sport (UK). (January 28, 2021). Annual trading income of the Science Museum Group (SMG) in England from financial year 2008 to 2020 (in 1,000 GBP) [Graph]. In Statista. Retrieved April 09, 2025, from https://www.statista.com/statistics/422457/trading-income-science-museum-group-england-uk/
Department for Digital, Culture, Media and Sport (UK). "Annual trading income of the Science Museum Group (SMG) in England from financial year 2008 to 2020 (in 1,000 GBP)." Chart. January 28, 2021. Statista. Accessed April 09, 2025. https://www.statista.com/statistics/422457/trading-income-science-museum-group-england-uk/
Department for Digital, Culture, Media and Sport (UK). (2021). Annual trading income of the Science Museum Group (SMG) in England from financial year 2008 to 2020 (in 1,000 GBP). Statista. Statista Inc.. Accessed: April 09, 2025. https://www.statista.com/statistics/422457/trading-income-science-museum-group-england-uk/
Department for Digital, Culture, Media and Sport (UK). "Annual Trading Income of The Science Museum Group (Smg) in England from Financial Year 2008 to 2020 (in 1,000 Gbp)." Statista, Statista Inc., 28 Jan 2021, https://www.statista.com/statistics/422457/trading-income-science-museum-group-england-uk/
Department for Digital, Culture, Media and Sport (UK), Annual trading income of the Science Museum Group (SMG) in England from financial year 2008 to 2020 (in 1,000 GBP) Statista, https://www.statista.com/statistics/422457/trading-income-science-museum-group-england-uk/ (last visited April 09, 2025)
Annual trading income of the Science Museum Group (SMG) in England from financial year 2008 to 2020 (in 1,000 GBP) [Graph], Department for Digital, Culture, Media and Sport (UK), January 28, 2021. [Online]. Available: https://www.statista.com/statistics/422457/trading-income-science-museum-group-england-uk/
Profit from additional features with an Employee Account
Please create an employee account to be able to mark statistics as favorites.
Then you can access your favorite statistics via the star in the header.
Profit from the additional features of your individual account
Currently, you are using a shared account. To use individual functions (e.g., mark statistics as favourites, set
statistic alerts) please log in with your personal account.
If you are an admin, please authenticate by logging in again.