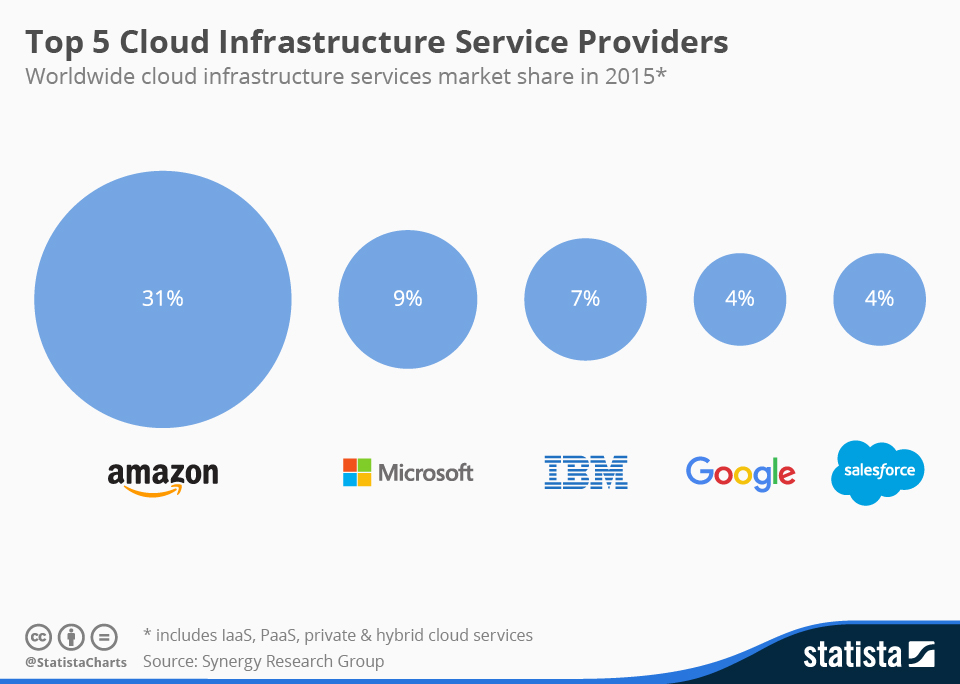
Google is a company that is used to winning. So many of the company’s products and services are industry-leading (think Search, Android, Maps or Gmail), that you have to think twice to find an industry in which Google is running behind. The cloud industry is one of these exemptions. In the past year, Google’s cloud infrastructure market share amounted to just 4 percent, trailing industry leader Amazon Web Services by a long shot, as our chart, based on Synergy Research data, illustrates.
John Dinsdale, an analyst at Synergy Research Group, attributed Google’s weak position in the cloud industry at least partly to the company’s insufficient network of data centers. An issue that will now be addressed: By the end of 2017, Google plans to build 12 new data centers around the world to increase the global footprint of its Cloud Platform services, the company announced on Tuesday. After the expansion, Google’s Cloud Platform will be available in 15 regions across the globe – market leader Amazon Web Services covers 12 regions with plans for 5 more.
Diane Greene, the recently appointed leader of Google’s cloud business, went on record at a press conference yesterday saying that her company is “dead serious” about the cloud business and willing to back up those ambitions with huge investments. According to Greene, Google invested nearly $10 billion of capital expenditures to build its cloud business in the past year alone.
It’ll be interesting to see how the below chart will look a few years from now. A lot of heavyweights have thrown their hat in the ring and no one shows signs of backing away from the billion-dollar feeding frenzy that is the cloud market.
Google's Cloud Ambitions

Description
This chart shows worldwide cloud infrastructure market share for the Top 5 providers in 2015.


