These days, smartphone users have millions of apps to choose from. But how many apps do they actually use? According to a recent Nielsen report, the answer is: a little more than two dozens.
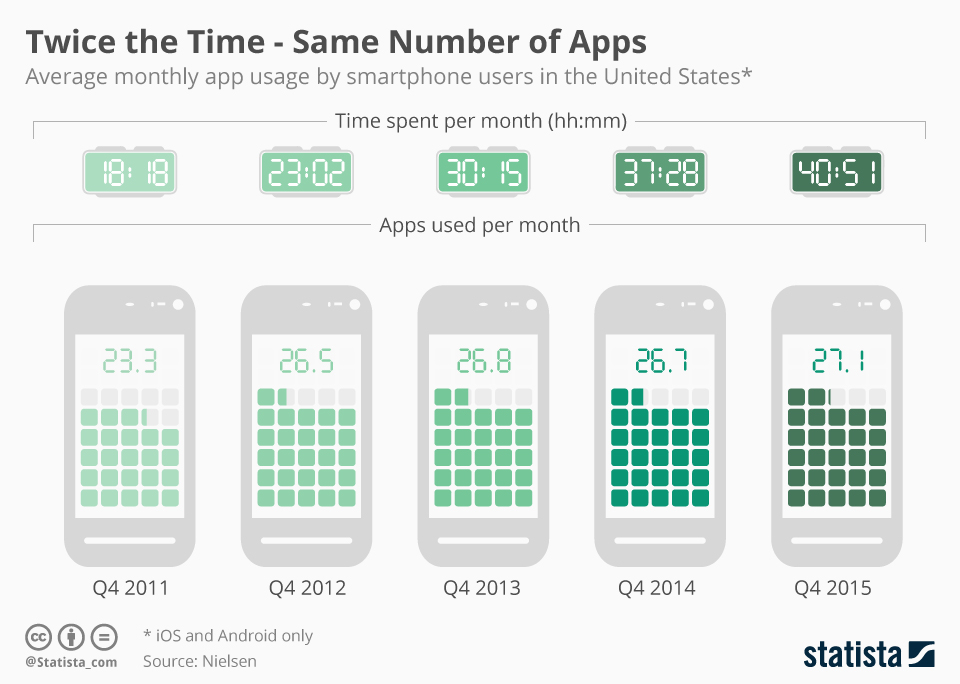
In the fourth quarter of 2015, iPhone and Android smartphone users in the U.S. used an average of 27.1 apps per month, spending more than 40 hours with them. Interestingly, the amount of time people spend with apps continues to increase, whereas the number of apps they use pretty much stopped growing three years ago.
Apparently, there's a limit to how many apps people actually use, regardless of how many apps are available and how much time they spend using them. To put it differently: there's an app for every need, but there's no need for every app.
Related Infographics
FAQ
- The Statista "Chart of the Day", made available under the Creative Commons License CC BY-ND 3.0, may be used and displayed without charge by all commercial and non-commercial websites. Use is, however, only permitted with proper attribution to Statista. When publishing one of these graphics, please include a backlink to the respective infographic URL. More Information
- The Statista "Chart of the Day" currently focuses on two sectors: "Media and Technology", updated daily and featuring the latest statistics from the media, internet, telecommunications and consumer electronics industries; and "Economy and Society", which current data from the United States and around the world relating to economic and political issues as well as sports and entertainment.
- For individual content and infographics in your Corporate Design, please visit our agency website www.statista.design
Any more questions?
Get in touch with us quickly and easily.
We are happy to help!
Do you still have questions?
Feel free to contact us anytime using our contact form or visit our FAQ page.
Your contact to the Infographics Newsroom


Statista Content & Design
Need infographics, animated videos, presentations, data research or social media charts?