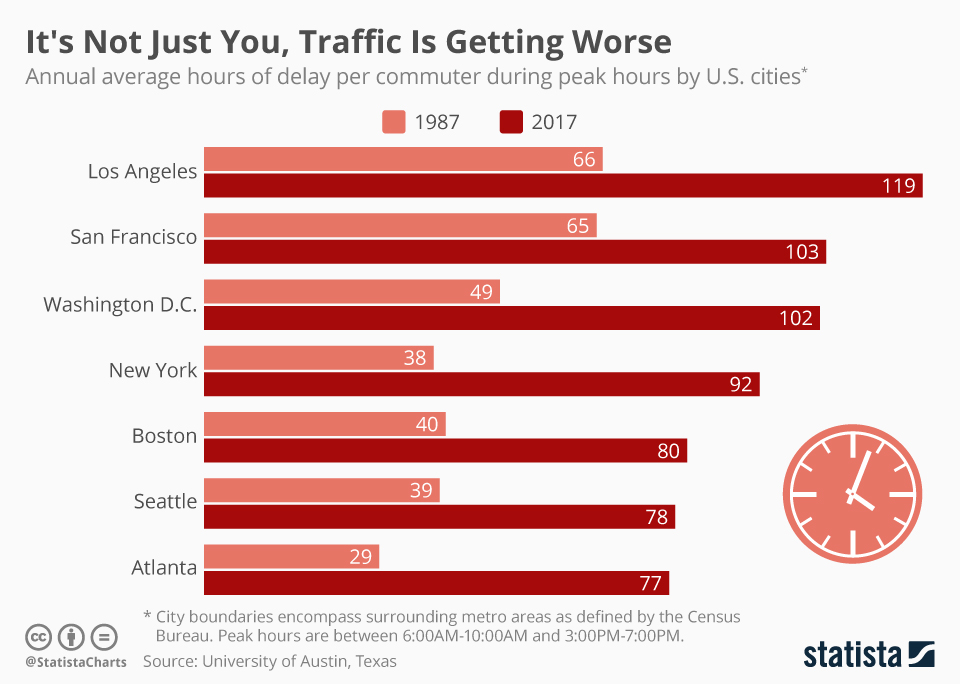
LA drivers spent the equivalent of 5 days stalled in traffic in 2017. The average driver in the Los Angeles area spent 119 hours in rush hour traffic, according to the most recent data from the University of Austin, Texas’ 2019 Mobility Report. Three decades ago, the average LA driver spent 66 hours a year in traffic. The 2017 congestion numbers post an 80 percent increase in average hours a year for drivers stuck in traffic.
While LA is famous for its traffic, this is not an LA-specific issue, with cities and towns both big and small posting significant increases in congestion over the past three-plus decades. An expanding nation and, as a result, a growing workforce are both factors at play in the increasing congestion plaguing American roadways. Since 1982, there are 50 percent more people in the workforce, and while people are increasingly working from home, most are still commuting to office space during peak hours. The only year-over-year decrease in congestion was between 2008 and 2009 when the U.S. economy was reeling from the worst economic contraction and high unemployment, the country had seen since the Great Depression.
People on the roadways pay for this congestion through their time, but the economy pays for these delays through costly inefficiencies. The annual cost of traffic delays per commuter has nearly doubled, rising to $1,010. That is nearly double what it was in the early 1980s.
It's Not Just You, Traffic Is Getting Worse
Traffic Congestion
Description
This chart shows the annual average hours of delay per commuter during peak hours by U.S. cities.