A new report from the Center for International Environmental Law has examined the environmental impact of plastic production and incineration. It found that the plastic lifecycle will add 850 million metric tons of greenhouse gases to the atmosphere this year, equal to the emissions from 189 500 megawatt coal-fired power plants. Emissions from plastic are now threatening the ability of the global community to meet carbon emissions targets. The research also looked at the path of plastic waste and it found that only 9 percent of all plastic every discarded in the U.S. since 1950 has been recycled while 12 percent has been incinerated.
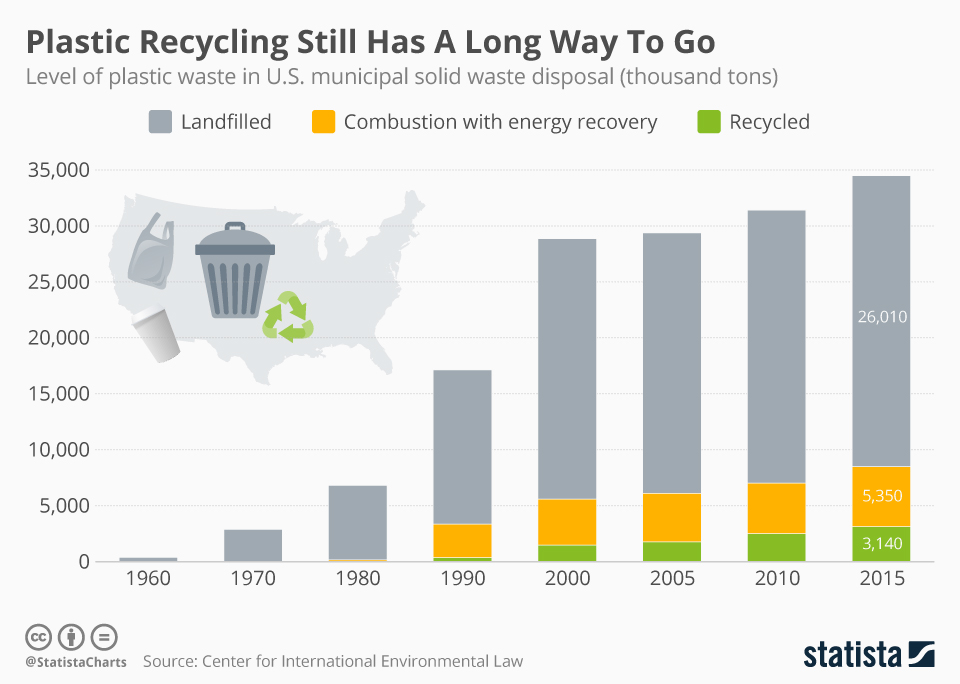
The plastic floating in our oceans, clogging our canals and coating our pavements rightfully receives the majority of attention from campaigners but its fate in the waste disposal system is often overlooked. The following infographic shows the total amount of plastic generated annually since the 60s and what happens to it once it goes into the garbage. Given how little has been recycled over the years, it comes as little surprise that most of it ends up in landfill. In 2015, 34.5 million tons of plastic waste was generated in the U.S. with 26 million tons landfilled. 5.4 million tons ended up being combusted for energy while only 3.1 million tons was recycled.
Given the extent of the global backlash against plastic, why does so little of it get recycled? Plastic packaging is notoriously difficult to recycle and it represents 40 percent of total production of plastic products. Even when plastic can be recycled, the process tends to involve many steps requiring separate collection, long-distance transportation, processing and re-manufacture. That then results in high costs and low value of the recycled product, meaning the process is rarely profitable and needs generous goverment subsidies. Of course, an unknown quantity of plastic wage is mismanaged, mainly due to littering and open burning. Even though the mismanagement rate is relatively low in the U.S. compared to other developed nations, it is still known as one of the major contributors to plastic ocean leakage.
Plastic Recycling Still Has A Long Way To Go
Plastic Pollution

Description
This chart shows the level of plastic waste in the U.S. municipal solid waste disposal (thousand tons).


