Uber filed for its highly-anticipated IPO on Thursday, providing the general public with a first glimpse of its explosive growth and piling losses.
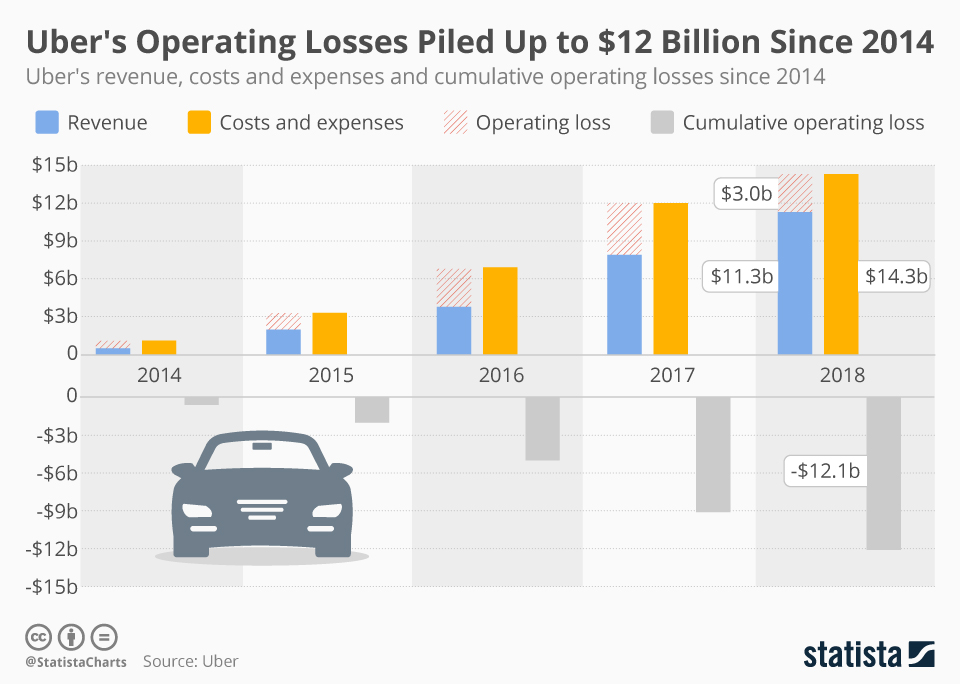
According to the filing, Uber had 91 million monthly active users by the end of last year. Gross bookings from ridesharing trips and Uber Eats meal deliveries amounted to $49.8 billion in 2018, up from $34.4 billion in 2017 and $19.2 billion the year before that. After paying nearly $40 billion to drivers and restaurants, the company’s actual cut is much smaller than that though, with net revenue amounting to $11.3 billion in 2018. Total costs and expenses, including direct costs of revenue as well as operating expenses, sales and marketing costs, R&D spending and general and administrative costs, amounted to $14.3 billion, however, leaving the company with an operating loss of $3 billion in 2018.
Speaking of losses, the market leader in the ridesharing space amassed operating losses in excess of $12 billion since 2014, making it the king of loss-making tech unicorns. Even Amazon, infamous for losing money in its early years, never piled up losses at a rate even remotely close to Uber’s. And yet, the company based in San Francisco is expected to seek a valuation of more than $100 billion in its upcoming IPO. Lyft, Uber’s similarly loss-laden main competitor in the United States, went public at a valuation of $24 billion in late March. Its shares are currently trading 15 percent below the IPO price, however, leaving many people wondering whether the same will happen to Uber.
Uber's Operating Losses Piled Up to $12 Billion Since 2014
Uber IPO

Description
This chart shows Uber's revenue, costs and expenses and cumulative operating losses since 2014.


