On Tuesday, Indian warplanes attacked targets across the ceasefire line in disputed Kashmir in response to a militant attack that killed 40 Indian troops. Pakistan now claims to have shot down two Indian jets and captured one of their their pilots after a MIG-21 Bison fighter crashed in its territory. India made no comments on those claims but the country’s ANI news agency also reported on Wednesday that a Pakistani F-16 fighter jet was also shot down.
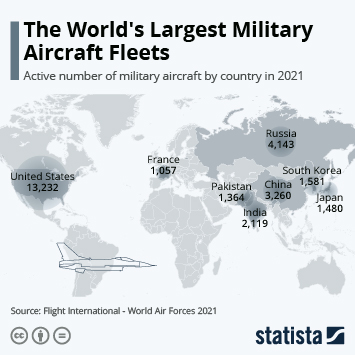
Domestic air travel in major Pakistani cities such as Islamabad and Lahore has been suspended as the crisis between the two nuclear-armed neighbors continues to escalate. The following infographic shows the military balance between both nations with India firmly ahead in terms of budget, troop numbers and volume of equipment. The figures are primarily based on reporting from the Institute of Strategic Studies and published by Al Jazeera.
Related Infographics
FAQ
- The Statista "Chart of the Day", made available under the Creative Commons License CC BY-ND 3.0, may be used and displayed without charge by all commercial and non-commercial websites. Use is, however, only permitted with proper attribution to Statista. When publishing one of these graphics, please include a backlink to the respective infographic URL. More Information
- The Statista "Chart of the Day" currently focuses on two sectors: "Media and Technology", updated daily and featuring the latest statistics from the media, internet, telecommunications and consumer electronics industries; and "Economy and Society", which current data from the United States and around the world relating to economic and political issues as well as sports and entertainment.
- For individual content and infographics in your Corporate Design, please visit our agency website www.statista.design
Any more questions?
Get in touch with us quickly and easily.
We are happy to help!
Do you still have questions?
Feel free to contact us anytime using our contact form or visit our FAQ page.
Your contact to the Infographics Newsroom
Statista Content & Design
Need infographics, animated videos, presentations, data research or social media charts?