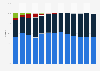
The statistic shows the proportion of raw materials worldwide that are used to produce 1.3 billion mobile phones in 2010. Approximately 1.5 percent of the global silver production was used to produce 1.3 billion mobile phones worldwide.
Proportion of raw materials used worldwide for the production of 1.3 billion mobile phones as of 2010
Basic Account
Get to know the platform
You only have access to basic statistics.
This statistic is not included in your account.
Starter Account
The ideal entry-level account for individual users
- Instant access to 1m statistics
- Download in XLS, PDF & PNG format
- Detailed references
$199 USD / Month *
Professional Account
Full access
Business Solutions including all features.
* Prices do not include sales tax.
Other statistics that may interest you Statistics on
About the industry
9
- Premium Statistic Import dependence for non-ferrous metal ores in the European Union (EU) 2018
- Premium Statistic Global market size of selected metals 2022
- Basic Statistic Vale's employee number 2010-2022
- Premium Statistic Vale's share earnings 2012-2020
- Basic Statistic Net value of minerals Australia FY 2018 by type
- Premium Statistic Global mining industry M&A deal value 2016 & 2017, by commodity
- Premium Statistic Capex distribution for top mineral commodities worldwide 2016
- Premium Statistic Annual commodity demand for mobile phones 2010
- Premium Statistic Distribution of expenses in the mining industry in South Africa 2023, by type
About the region
10
- Premium Statistic Norilsk Nickel's number of employees 2010-2022
- Premium Statistic Norilsk Nickel's annual revenue 2010-2023
- Premium Statistic Norilsk Nickel's profit 2010-2022
- Basic Statistic Prices index comparison of seven different precious metals 2019-2022
- Premium Statistic Comparison of the S&P GSCI precious metals index and the S&P 500 index 2019-2024
- Premium Statistic Value of precious metal exports from Russia monthly 2021-2023
- Premium Statistic Turkey: monthly value of precious metal exports 2017-2018
- Premium Statistic Germany: monthly value of precious metal imports 2017
- Premium Statistic Ireland: monthly value of precious metal imports 2017
- Premium Statistic Vale's precious metal production 2012-2023
Selected statistics
5
Other regions
10
- Premium Statistic Biggest ETFs for precious metals based on three month return rate in the U.S. 2022
- Premium Statistic Canada's global ranking of selected mineral commodity production 2022
- Premium Statistic Export value of precious metals Vietnam 2020, by type
- Premium Statistic Italy: market price of raw materials for jewelry sector 2013-2019
- Premium Statistic Market share of mobile operating systems Qatar 2015-2020
- Premium Statistic Share of mobile operating systems in Pakistan 2014-2017, by month
- Premium Statistic Panama: mobile phone internet user penetration 2017-2020
- Premium Statistic Puerto Rico: mobile phone internet user penetration 2017-2020
- Premium Statistic Dominican Republic: mobile phone internet user penetration 2017-2020
- Premium Statistic Smartphone brands market share Asia 2018
Related statistics
10
- Premium Statistic Global critical minerals production share 2023, by majority producing country
- Premium Statistic Number of active mineral exploration sites worldwide by region 2017
- Premium Statistic Global number of active mineral exploration sites 2017, by region and type
- Premium Statistic Distribution of active mineral exploration sites worldwide by region 2017
- Premium Statistic Global palladium consumption distribution 2022, by industry
- Premium Statistic Global palladium consumption 2022, by industry
- Premium Statistic Global palladium consumption distribution 2022, by region
- Premium Statistic Global demand for platinum 2005-2023
- Premium Statistic Platinum-group metal reserves worldwide 2023, by country
- Premium Statistic Precious metals exports from Mexico 2015-2022, by metal
Further related statistics
10
- China Mobile's total assets 2012-2022
- China Mobile's EBITDA 2012-2022
- Number of China Unicom mobile subscriptions 2012-2022
- Device usage among children to consume media in the United Kingdom (UK) 2013-2019
- Apple iPhone sales worldwide 2007-2023
- Podcast consumption on mobile in the U.S. 2017
- Cities with the largest share of parkland in the U.S. 2022
- BlackBerry net income/loss 2009-2023
- Agnico-Eagle Mines' gold reserves 2000-2023
- Number of employees at China Telecom 2012-2022
Further Content: You might find this interesting as well
Statistics
- China Mobile's total assets 2012-2022
- China Mobile's EBITDA 2012-2022
- Number of China Unicom mobile subscriptions 2012-2022
- Device usage among children to consume media in the United Kingdom (UK) 2013-2019
- Apple iPhone sales worldwide 2007-2023
- Podcast consumption on mobile in the U.S. 2017
- Cities with the largest share of parkland in the U.S. 2022
- BlackBerry net income/loss 2009-2023
- Agnico-Eagle Mines' gold reserves 2000-2023
- Number of employees at China Telecom 2012-2022
LOG.Kompass. (December 8, 2010). Proportion of raw materials used worldwide for the production of 1.3 billion mobile phones as of 2010 [Graph]. In Statista. Retrieved May 19, 2024, from https://www.statista.com/statistics/270791/proportion-of-raw-materials-used-in-mobile-phones/
LOG.Kompass. "Proportion of raw materials used worldwide for the production of 1.3 billion mobile phones as of 2010." Chart. December 8, 2010. Statista. Accessed May 19, 2024. https://www.statista.com/statistics/270791/proportion-of-raw-materials-used-in-mobile-phones/
LOG.Kompass. (2010). Proportion of raw materials used worldwide for the production of 1.3 billion mobile phones as of 2010. Statista. Statista Inc.. Accessed: May 19, 2024. https://www.statista.com/statistics/270791/proportion-of-raw-materials-used-in-mobile-phones/
LOG.Kompass. "Proportion of Raw Materials Used Worldwide for The Production of 1.3 Billion Mobile Phones as of 2010." Statista, Statista Inc., 8 Dec 2010, https://www.statista.com/statistics/270791/proportion-of-raw-materials-used-in-mobile-phones/
LOG.Kompass, Proportion of raw materials used worldwide for the production of 1.3 billion mobile phones as of 2010 Statista, https://www.statista.com/statistics/270791/proportion-of-raw-materials-used-in-mobile-phones/ (last visited May 19, 2024)
Proportion of raw materials used worldwide for the production of 1.3 billion mobile phones as of 2010 [Graph], LOG.Kompass, December 8, 2010. [Online]. Available: https://www.statista.com/statistics/270791/proportion-of-raw-materials-used-in-mobile-phones/