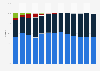
The statistic shows the commodity demand for 1.3 billion mobile phones sold worldwide as of 2010. The production of these phones would required 12,000 tons of copper per year.
Annual commodity demand for 1.3 billion mobile phones sold worldwide as of 2010 (in tons)
Basic Account
Get to know the platform
You only have access to basic statistics.
This statistic is not included in your account.
Starter Account
The ideal entry-level account for individual users
- Instant access to 1m statistics
- Download in XLS, PDF & PNG format
- Detailed references
$199 USD / Month *
Professional Account
Full access
Business Solutions including all features.
* Prices do not include sales tax.
Other statistics that may interest you Statistics on
About the industry
9
- Premium Statistic Orano's revenue distribution by region 2022
- Premium Statistic Orano's revenue 2010-2022
- Basic Statistic BHP's production of copper 2010-2023
- Premium Statistic Turnover of Areva 2008-2016
- Premium Statistic China's share of selected global raw material reserves 2011
- Premium Statistic Rare earths - reserves in China
- Premium Statistic Rare Earth - China Export
- Premium Statistic India: exports of iron ore
- Basic Statistic Orano's revenue share by segment 2022
About the region
10
- Premium Statistic Iron ore production of BHP 2010-2023
- Premium Statistic Prices of rare earth oxides 2020, by type
- Premium Statistic Materials used in smartphones 2017
- Basic Statistic Reserves of yttrium worldwide by country 2013
- Basic Statistic Yttrium mine production worldwide 2010-2013 by country
- Basic Statistic Distribution of future rare earth sources outside China as of 2012
- Basic Statistic Mining companies - rare earth projects worldwide by phase 2012
- Basic Statistic Projected share of global rare earth supply by element 2015
- Basic Statistic Prices for rare earths worldwide 2007-2010
- Premium Statistic Application areas of rare earths 2012
Selected statistics
5
Other regions
9
- Premium Statistic Kazatomprom's revenue 2014-2022
- Premium Statistic Cement production in Saudi Arabia 2013-2021
- Premium Statistic Anglo American's revenue in Chile 2013-2023
- Basic Statistic Distribution of Argentina's oil exports by country 2010
- Basic Statistic China's crude oil imports by source country 2014
- Basic Statistic Nigerian oil export shares by destination region 2015
- Premium Statistic BP's payments related to the oil spill in the Gulf of Mexico 2013
- Premium Statistic Crude oil exports from Venezuela 2022, by region of destination
- Premium Statistic Russia: nickel mine production 2006-2023
Related statistics
9
- Premium Statistic Rare earths - consumption volume, by application area 2008
- Basic Statistic Rare earths - demand in 2014
- Premium Statistic Global nickel consumption 2010-2022
- Premium Statistic Vale's revenue 2010-2022
- Basic Statistic Vale's employee number 2010-2022
- Premium Statistic Vale's net income 2010-2022
- Premium Statistic Vale's production of copper 2010-2023
- Premium Statistic Vale's precious metal production 2012-2023
- Basic Statistic Glencore's cash flow 2010-2023
Further related statistics
10
- Glencore's sales of energy products 2010-2023
- U.S. imports of hydraulic cement 2010-2023
- U.S. cement production volume 2010-2023
- Global clinker production capacity 2023, by country
- Crushed stone price in the U.S. 2010-2023
- Global oil production share 2010-2022, by region
- Coal consumption in South Africa 1998-2022
- China Mobile's EBITDA 2012-2022
- China Mobile's total assets 2012-2022
- Number of employees at China Telecom 2012-2022
Further Content: You might find this interesting as well
Statistics
- Glencore's sales of energy products 2010-2023
- U.S. imports of hydraulic cement 2010-2023
- U.S. cement production volume 2010-2023
- Global clinker production capacity 2023, by country
- Crushed stone price in the U.S. 2010-2023
- Global oil production share 2010-2022, by region
- Coal consumption in South Africa 1998-2022
- China Mobile's EBITDA 2012-2022
- China Mobile's total assets 2012-2022
- Number of employees at China Telecom 2012-2022
LOG.Kompass. (December 8, 2010). Annual commodity demand for 1.3 billion mobile phones sold worldwide as of 2010 (in tons) [Graph]. In Statista. Retrieved May 19, 2024, from https://www.statista.com/statistics/270790/annual-commodity-demand-for-mobile-phones/
LOG.Kompass. "Annual commodity demand for 1.3 billion mobile phones sold worldwide as of 2010 (in tons)." Chart. December 8, 2010. Statista. Accessed May 19, 2024. https://www.statista.com/statistics/270790/annual-commodity-demand-for-mobile-phones/
LOG.Kompass. (2010). Annual commodity demand for 1.3 billion mobile phones sold worldwide as of 2010 (in tons). Statista. Statista Inc.. Accessed: May 19, 2024. https://www.statista.com/statistics/270790/annual-commodity-demand-for-mobile-phones/
LOG.Kompass. "Annual Commodity Demand for 1.3 Billion Mobile Phones Sold Worldwide as of 2010 (in Tons)." Statista, Statista Inc., 8 Dec 2010, https://www.statista.com/statistics/270790/annual-commodity-demand-for-mobile-phones/
LOG.Kompass, Annual commodity demand for 1.3 billion mobile phones sold worldwide as of 2010 (in tons) Statista, https://www.statista.com/statistics/270790/annual-commodity-demand-for-mobile-phones/ (last visited May 19, 2024)
Annual commodity demand for 1.3 billion mobile phones sold worldwide as of 2010 (in tons) [Graph], LOG.Kompass, December 8, 2010. [Online]. Available: https://www.statista.com/statistics/270790/annual-commodity-demand-for-mobile-phones/