
M. Shahbandeh
Research expert covering agriculture & FMCG

Detailed statistics
Cheese production in the U.S. 2023, by state
Detailed statistics
Cheese production in the U.S. 2023, by state

Detailed statistics
Cheese production in the U.S. 2013-2024
Detailed statistics
Cheese production in the U.S. 2013-2024

Detailed statistics
Top countries of destination for U.S. cheese and curd exports 2013
Detailed statistics
Top countries of destination for U.S. cheese and curd exports 2013

Leading countries in cheese production 2024
Major cheese producing countries in 2024 (in 1,000 metric tons)
Leading countries in cheese production 2024
Major cheese producing countries in 2024 (in 1,000 metric tons)
Cheese production in the U.S. 2013-2024
Volume of cheese produced in the U.S. from 2013 to 2024 (in million metric tons)*
Cheese production in the U.S. 2013-2024
Volume of cheese produced in the U.S. from 2013 to 2024 (in million metric tons)*
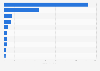
Cheese production in the U.S. 2023, by state
Leading U.S. states in total cheese production in 2023 (in 1,000 pounds)*
Cheese production in the U.S. 2023, by state
Leading U.S. states in total cheese production in 2023 (in 1,000 pounds)*

Cheddar cheese production in the U.S. 2004-2023
Quantity of cheddar cheese produced in the U.S. from 2004 to 2023 (in 1,000 pounds)
Cheddar cheese production in the U.S. 2004-2023
Quantity of cheddar cheese produced in the U.S. from 2004 to 2023 (in 1,000 pounds)

Italian cheese production in the U.S. 2004-2023
Quantity of all Italian cheese produced in the U.S. from 2004 to 2023 (in 1,000 pounds)
Italian cheese production in the U.S. 2004-2023
Quantity of all Italian cheese produced in the U.S. from 2004 to 2023 (in 1,000 pounds)

Swiss cheese production in the U.S. 2004-2023
Quantity of Swiss cheese produced in the U.S. from 2004 to 2023 (in 1,000 pounds)
Swiss cheese production in the U.S. 2004-2023
Quantity of Swiss cheese produced in the U.S. from 2004 to 2023 (in 1,000 pounds)

U.S. market value of cheese 2020-2030
Forecast market value of cheese in the United States from 2020 to 2030 (in billion U.S. dollars)*
U.S. market value of cheese 2020-2030
Forecast market value of cheese in the United States from 2020 to 2030 (in billion U.S. dollars)*

Projected U.S. cheese production by type 2022-2033
Projected cheese production in the U.S. from 2022 to 2033, by type (in million pounds)
Projected U.S. cheese production by type 2022-2033
Projected cheese production in the U.S. from 2022 to 2033, by type (in million pounds)

Projected cheese prices 2010-2033
Projected cheese prices in the U.S. from 2010 to 2033 (in U.S. dollars per pound)*
Projected cheese prices 2010-2033
Projected cheese prices in the U.S. from 2010 to 2033 (in U.S. dollars per pound)*

Projected per capita cheese consumption in the U.S. 2010-2033
Projected per capita consumption of cheese in the U.S. from 2010 to 2033 (in pounds)
Projected per capita cheese consumption in the U.S. 2010-2033
Projected per capita consumption of cheese in the U.S. from 2010 to 2033 (in pounds)

U.S. retail sales of cheese 2022, by form
Retail sales of cheese in the United States in 2022, by form (in million U.S. dollars)*
U.S. retail sales of cheese 2022, by form
Retail sales of cheese in the United States in 2022, by form (in million U.S. dollars)*

Private labels and branded cheese sales growth by type U.S. 2023
Private labels and branded cheese products sales growth in the U.S. 2023, by cheese type
Private labels and branded cheese sales growth by type U.S. 2023
Private labels and branded cheese products sales growth in the U.S. 2023, by cheese type

Sales growth of private label and overall cream cheese category U.S. 2023
Private label and branded cream cheese sales cahnges in the United States in 2023
Sales growth of private label and overall cream cheese category U.S. 2023
Private label and branded cream cheese sales cahnges in the United States in 2023

Cream cheese sales value share by segment in the U.S. 2023
Cream cheese sales value share in the United States 2023, by segment
Cream cheese sales value share by segment in the U.S. 2023
Cream cheese sales value share in the United States 2023, by segment

U.S. retail price of processed cheese 1995-2024
Retail price of American processed cheese in the United States from 1995 to 2024 (in U.S. dollars per pound)
U.S. retail price of processed cheese 1995-2024
Retail price of American processed cheese in the United States from 1995 to 2024 (in U.S. dollars per pound)

U.S. retail price of cheddar cheese 1995-2024
Retail price of cheddar cheese (natural) in the United States from 1995 to 2024 (in U.S. dollars per pound)
U.S. retail price of cheddar cheese 1995-2024
Retail price of cheddar cheese (natural) in the United States from 1995 to 2024 (in U.S. dollars per pound)

Unit sales of the leading brands of grated cheese in the United States 2023
Leading brands of shredded/grated cheese in the United States in 2023, based on unit sales (in million units)
Unit sales of the leading brands of grated cheese in the United States 2023
Leading brands of shredded/grated cheese in the United States in 2023, based on unit sales (in million units)

Leading grated cheese brands sales of the U.S. 2024
Sales of the leading shredded/grated cheese brands of the United States in 2024 (in million U.S. dollars)
Leading grated cheese brands sales of the U.S. 2024
Sales of the leading shredded/grated cheese brands of the United States in 2024 (in million U.S. dollars)
Leading natural sliced cheese brands sales in the U.S. 2023
Sales of the leading natural sliced cheese brands in the United States as of January 2023 (in million U.S. dollars)
Leading natural sliced cheese brands sales in the U.S. 2023
Sales of the leading natural sliced cheese brands in the United States as of January 2023 (in million U.S. dollars)

U.S. sales value of the leading natural cheese stick brands 2024
Sales value of the leading natural cheese-string or sticks brands in the United States in 2024 (in million U.S. dollars)
U.S. sales value of the leading natural cheese stick brands 2024
Sales value of the leading natural cheese-string or sticks brands in the United States in 2024 (in million U.S. dollars)

Sales value of the leading soft cream cheese brands in the U.S. in 2024
Sales value of the leading soft cream cheese brands in the United States in 2024 (in million U.S. dollars)
Sales value of the leading soft cream cheese brands in the U.S. in 2024
Sales value of the leading soft cream cheese brands in the United States in 2024 (in million U.S. dollars)

U.S. sales value of the leading cottage cheese brands 2024
Sales value of the leading cottage cheese brands in the United States in 2024 (in millions U.S. dollars)
U.S. sales value of the leading cottage cheese brands 2024
Sales value of the leading cottage cheese brands in the United States in 2024 (in millions U.S. dollars)

Unit sales of the leading cottage cheese brands in the U.S. 2024
Unit sales of the leading cottage cheese brands in the United States as of 2024 (in million units)
Unit sales of the leading cottage cheese brands in the U.S. 2024
Unit sales of the leading cottage cheese brands in the United States as of 2024 (in million units)

Best-selling U.S. processed/imitation cheese brands 2023, based on dollar sales
Leading processed/imitation cheese slice brands in the United States in 2023, based on sales (in million U.S. dollars)
Best-selling U.S. processed/imitation cheese brands 2023, based on dollar sales
Leading processed/imitation cheese slice brands in the United States in 2023, based on sales (in million U.S. dollars)

U.S. per capita consumption of cheese 2000-2022
Per capita consumption of cheese in the United States from 2000 to 2022 (in pounds)
U.S. per capita consumption of cheese 2000-2022
Per capita consumption of cheese in the United States from 2000 to 2022 (in pounds)

Annual domestic consumption of American cheese in the U.S. 2010-2021
Annual domestic consumption of American cheese in the U.S. from 2010 to 2021 (in million pounds)*
Annual domestic consumption of American cheese in the U.S. 2010-2021
Annual domestic consumption of American cheese in the U.S. from 2010 to 2021 (in million pounds)*

U.S. domestic use of cottage cheese 2000-2023
Annual domestic consumption of cottage cheese in the United States from 2000 to 2023 (in million pounds)
U.S. domestic use of cottage cheese 2000-2023
Annual domestic consumption of cottage cheese in the United States from 2000 to 2023 (in million pounds)

U.S. per capita consumption of American cheese 2000-2022
Per capita consumption of American cheese in the United States from 2000 to 2022 (in pounds)
U.S. per capita consumption of American cheese 2000-2022
Per capita consumption of American cheese in the United States from 2000 to 2022 (in pounds)

U.S. per capita consumption of cottage cheese 2000-2022
Per capita consumption of cottage cheese in the United States from 2000 to 2022 (in pounds)
U.S. per capita consumption of cottage cheese 2000-2022
Per capita consumption of cottage cheese in the United States from 2000 to 2022 (in pounds)

U.S. per capita consumption of Italian cheese 2000-2022
Per capita consumption of Italian cheese in the United States from 2000 to 2022 (in pounds)
U.S. per capita consumption of Italian cheese 2000-2022
Per capita consumption of Italian cheese in the United States from 2000 to 2022 (in pounds)

U.S. per capita consumption of Swiss cheese 2000-2022
Per capita consumption of Swiss cheese in the United States from 2000 to 2022 (in pounds)*
U.S. per capita consumption of Swiss cheese 2000-2022
Per capita consumption of Swiss cheese in the United States from 2000 to 2022 (in pounds)*

U.S. per capita consumption of cream cheese 2000-2022
Per capita consumption of cream cheese and Neufchatel in the United States from 2000 to 2022 (in pounds)
U.S. per capita consumption of cream cheese 2000-2022
Per capita consumption of cream cheese and Neufchatel in the United States from 2000 to 2022 (in pounds)
Projected cheese prices 2010-2033
Projected cheese prices in the U.S. from 2010 to 2033 (in U.S. dollars per pound)*
Projected cheese prices 2010-2033
Projected cheese prices in the U.S. from 2010 to 2033 (in U.S. dollars per pound)*

Consumption of speciality cheese in the U.S. in 2023, by generation
Share of consumers who consume specialty cheese in the United States in 2023, by generation
Consumption of speciality cheese in the U.S. in 2023, by generation
Share of consumers who consume specialty cheese in the United States in 2023, by generation


Mon - Fri, 9am - 6pm (EST)
Mon - Fri, 9am - 5pm (SGT)
Mon - Fri, 10:00am - 6:00pm (JST)
Mon - Fri, 9:30am - 5pm (GMT)
Mon - Fri, 9am - 6pm (EST)
