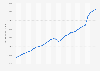
In 2020, the average sales per square foot of Ross Stores' selling space was 327 U.S. dollars, down from 432 dollars registered a year earlier. Ross Stores offer discounted apparel, accessories, footwear, and home fashion products.
Sales per average square foot of Ross Stores, Inc. stores in the United States from 2014 to 2020
(in U.S. dollars)
Characteristic
Sales per squre foot in U.S. dollars
2020
327
2019
432
2018
422
2017*
409
2016
395
2015
383
2014
372
0100200300400500
Add this content to your personal favorites. These can be accessed from the favorites menu in the main navigation.
You have no right to use this feature.
Make sure to contact us if you are interested in scientific citation.
You can upgrade your account to enable this functionality for all statistics.
This feature is not available with your current account.Request access
* Fiscal year 2017 had 53 weeks. All other fiscal years presented were 52 weeks.
Figures prior to 2016 were retrieved from earlier releases of the source.
Learn more about how Statista can support your business.
Ross Stores. (March 30, 2021). Sales per average square foot of Ross Stores, Inc. stores in the United States from 2014 to 2020 (in U.S. dollars) [Graph]. In Statista. Retrieved February 20, 2025, from https://www.statista.com/statistics/994312/sales-per-average-square-foot-of-ross-stores-inc-us/
Ross Stores. "Sales per average square foot of Ross Stores, Inc. stores in the United States from 2014 to 2020 (in U.S. dollars)." Chart. March 30, 2021. Statista. Accessed February 20, 2025. https://www.statista.com/statistics/994312/sales-per-average-square-foot-of-ross-stores-inc-us/
Ross Stores. (2021). Sales per average square foot of Ross Stores, Inc. stores in the United States from 2014 to 2020 (in U.S. dollars). Statista. Statista Inc.. Accessed: February 20, 2025. https://www.statista.com/statistics/994312/sales-per-average-square-foot-of-ross-stores-inc-us/
Ross Stores. "Sales per Average Square Foot of Ross Stores, Inc. Stores in The United States from 2014 to 2020 (in U.S. Dollars)." Statista, Statista Inc., 30 Mar 2021, https://www.statista.com/statistics/994312/sales-per-average-square-foot-of-ross-stores-inc-us/
Ross Stores, Sales per average square foot of Ross Stores, Inc. stores in the United States from 2014 to 2020 (in U.S. dollars) Statista, https://www.statista.com/statistics/994312/sales-per-average-square-foot-of-ross-stores-inc-us/ (last visited February 20, 2025)
Sales per average square foot of Ross Stores, Inc. stores in the United States from 2014 to 2020 (in U.S. dollars) [Graph], Ross Stores, March 30, 2021. [Online]. Available: https://www.statista.com/statistics/994312/sales-per-average-square-foot-of-ross-stores-inc-us/
Profit from additional features with an Employee Account
Please create an employee account to be able to mark statistics as favorites.
Then you can access your favorite statistics via the star in the header.
Profit from the additional features of your individual account
Currently, you are using a shared account. To use individual functions (e.g., mark statistics as favourites, set
statistic alerts) please log in with your personal account.
If you are an admin, please authenticate by logging in again.