The comparable store sales of Ross Stores, Inc. in 2023 increased by five percent compared to the previous year. The information was not provided by the source for the year 2020, due to the circumstances surrounding the coronavirus (COVID-19) pandemic.
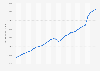
Comparable store sales growth of Ross Stores, Inc. in the United States from financial years 2014 to 2023
Characteristic
Comparable store sales growth
2023
5%
2022
-4%
2021
13%
2020
-
2019
3%
2018
4%
2017
4%
2016
4%
2015
4%
2014
3%
-5%-2.5%0%2.5%5%7.5%10%12.5%15%
Add this content to your personal favorites. These can be accessed from the favorites menu in the main navigation.
You have no right to use this feature.
Make sure to contact us if you are interested in scientific citation.
You can upgrade your account to enable this functionality for all statistics.
This feature is not available with your current account.Request access
Comparable stores are stores open for more than 14 complete months. This metric is not given for 2020. The source notes, "Given the temporary store closures resulting from the COVID-19 pandemic, the comparable store sales metric for fiscal 2020 is not meaningful". Fiscal year 2021 is compared to 2019, for the same reason. Fiscal years are 52 weeks ending at the end of January, except for 2017 and 2023 which were 53 weeks. Fiscal year 2023 ended February 3, 2024.
Learn more about how Statista can support your business.
Ross Stores. (March 27, 2024). Comparable store sales growth of Ross Stores, Inc. in the United States from financial years 2014 to 2023 [Graph]. In Statista. Retrieved February 20, 2025, from https://www.statista.com/statistics/994283/comparable-store-sales-growth-of-ross-stores-inc-us/
Ross Stores. "Comparable store sales growth of Ross Stores, Inc. in the United States from financial years 2014 to 2023." Chart. March 27, 2024. Statista. Accessed February 20, 2025. https://www.statista.com/statistics/994283/comparable-store-sales-growth-of-ross-stores-inc-us/
Ross Stores. (2024). Comparable store sales growth of Ross Stores, Inc. in the United States from financial years 2014 to 2023. Statista. Statista Inc.. Accessed: February 20, 2025. https://www.statista.com/statistics/994283/comparable-store-sales-growth-of-ross-stores-inc-us/
Ross Stores. "Comparable Store Sales Growth of Ross Stores, Inc. in The United States from Financial Years 2014 to 2023." Statista, Statista Inc., 27 Mar 2024, https://www.statista.com/statistics/994283/comparable-store-sales-growth-of-ross-stores-inc-us/
Ross Stores, Comparable store sales growth of Ross Stores, Inc. in the United States from financial years 2014 to 2023 Statista, https://www.statista.com/statistics/994283/comparable-store-sales-growth-of-ross-stores-inc-us/ (last visited February 20, 2025)
Comparable store sales growth of Ross Stores, Inc. in the United States from financial years 2014 to 2023 [Graph], Ross Stores, March 27, 2024. [Online]. Available: https://www.statista.com/statistics/994283/comparable-store-sales-growth-of-ross-stores-inc-us/
Profit from additional features with an Employee Account
Please create an employee account to be able to mark statistics as favorites.
Then you can access your favorite statistics via the star in the header.
Profit from the additional features of your individual account
Currently, you are using a shared account. To use individual functions (e.g., mark statistics as favourites, set
statistic alerts) please log in with your personal account.
If you are an admin, please authenticate by logging in again.