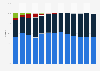
This statistic shows the average number of screens in Australian households between 2016 and 2018, by type. In the first half of 2018, there was an average of one tablet per household in Australia.
Average number of screens per household in Australia as of June 2018, by type
Profit from the additional features of your individual account
Currently, you are using a shared account. To use individual functions (e.g., mark statistics as favourites, set
statistic alerts) please log in with your personal account.
If you are an admin, please authenticate by logging in again.
Learn more about how Statista can support your business.
Thinktv. (August 28, 2018). Average number of screens per household in Australia as of June 2018, by type [Graph]. In Statista. Retrieved December 22, 2024, from https://www.statista.com/statistics/977621/average-screens-per-household-by-type-australia/
Thinktv. "Average number of screens per household in Australia as of June 2018, by type." Chart. August 28, 2018. Statista. Accessed December 22, 2024. https://www.statista.com/statistics/977621/average-screens-per-household-by-type-australia/
Thinktv. (2018). Average number of screens per household in Australia as of June 2018, by type. Statista. Statista Inc.. Accessed: December 22, 2024. https://www.statista.com/statistics/977621/average-screens-per-household-by-type-australia/
Thinktv. "Average Number of Screens per Household in Australia as of June 2018, by Type." Statista, Statista Inc., 28 Aug 2018, https://www.statista.com/statistics/977621/average-screens-per-household-by-type-australia/
Thinktv, Average number of screens per household in Australia as of June 2018, by type Statista, https://www.statista.com/statistics/977621/average-screens-per-household-by-type-australia/ (last visited December 22, 2024)
Average number of screens per household in Australia as of June 2018, by type [Graph], Thinktv, August 28, 2018. [Online]. Available: https://www.statista.com/statistics/977621/average-screens-per-household-by-type-australia/