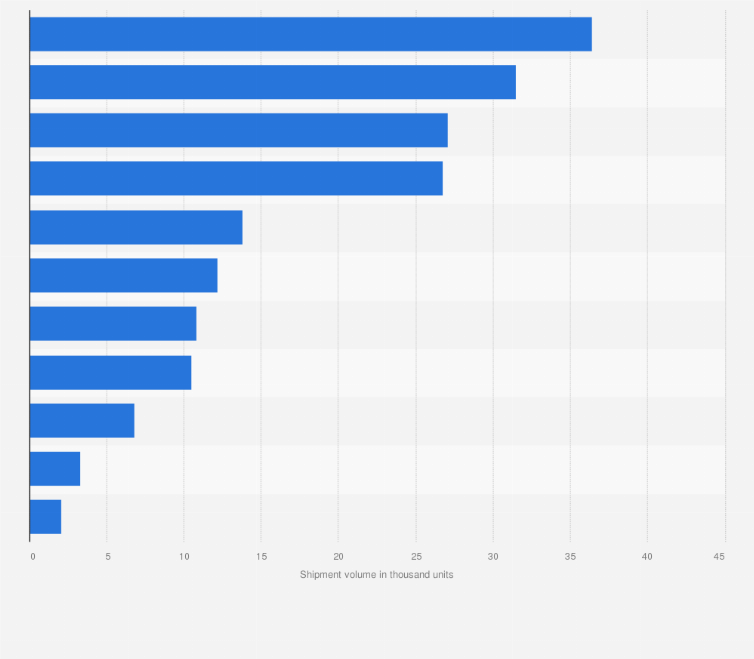
In 2023, Japanese manufacturers shipped approximately 63.06 thousand manipulators and robots for material handling, making it the most-shipped manipulator/robot category. The total domestic and export shipping volume of manipulators and robots in Japan reached about 227.38 thousand units in said year.
Total shipment volume of manipulators and robots in Japan in 2023, by application
(in 1,000 units)
Adjust the presentation of the statistic and data points.
Share the statistic on social media channels or embed the statistic in your
website using "Embed Code", where available.
Cite this statistic and select one of the following formats: APA, Chicago, Harvard, MLA & Bluebook.
Print the statistic including description and metadata.
Chart type
Total shipment volume of manipulators and robots in Japan in 2023, by application
Share this statistic
You have no right to use this feature.
Make sure to contact us if you are interested in scientific citation.
You can upgrade your account to enable this functionality for all statistics.
This feature is not available with your current account.Request access
Learn more about how Statista can support your business.
JARA. (May 30, 2024). Total shipment volume of manipulators and robots in Japan in 2023, by application (in 1,000 units) [Graph]. In Statista. Retrieved April 25, 2025, from https://www.statista.com/statistics/944924/japan-manipulator-robots-total-shipment-volume-by-application/
JARA. "Total shipment volume of manipulators and robots in Japan in 2023, by application (in 1,000 units)." Chart. May 30, 2024. Statista. Accessed April 25, 2025. https://www.statista.com/statistics/944924/japan-manipulator-robots-total-shipment-volume-by-application/
JARA. (2024). Total shipment volume of manipulators and robots in Japan in 2023, by application (in 1,000 units). Statista. Statista Inc.. Accessed: April 25, 2025. https://www.statista.com/statistics/944924/japan-manipulator-robots-total-shipment-volume-by-application/
JARA. "Total Shipment Volume of Manipulators and Robots in Japan in 2023, by Application (in 1,000 Units)." Statista, Statista Inc., 30 May 2024, https://www.statista.com/statistics/944924/japan-manipulator-robots-total-shipment-volume-by-application/
JARA, Total shipment volume of manipulators and robots in Japan in 2023, by application (in 1,000 units) Statista, https://www.statista.com/statistics/944924/japan-manipulator-robots-total-shipment-volume-by-application/ (last visited April 25, 2025)
Total shipment volume of manipulators and robots in Japan in 2023, by application (in 1,000 units) [Graph], JARA, May 30, 2024. [Online]. Available: https://www.statista.com/statistics/944924/japan-manipulator-robots-total-shipment-volume-by-application/
Profit from additional features with an Employee Account
Please create an employee account to be able to mark statistics as favorites.
Then you can access your favorite statistics via the star in the header.
Profit from the additional features of your individual account
Currently, you are using a shared account. To use individual functions (e.g., mark statistics as favourites, set
statistic alerts) please log in with your personal account.
If you are an admin, please authenticate by logging in again.