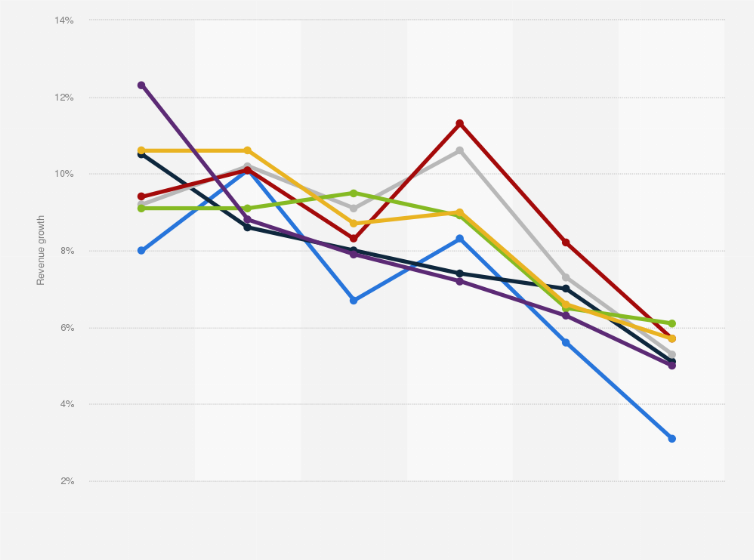
This statistic depicts the average annual revenue growth rate of residential renovation and design companies in the United States between 2014 and 2019, broken down by firm type. During the survey, interior designers reported an average revenue growth rate of 5.1 percent in 2019.
Average annual rate of revenue growth of residential renovation and design companies in the United States from 2014 to 2019, by firm type
Adjust the presentation of the statistic and data points.
Share the statistic on social media channels or embed the statistic in your
website using "Embed Code", where available.
Cite this statistic and select one of the following formats: APA, Chicago, Harvard, MLA & Bluebook.
Print the statistic including description and metadata.
Chart type
Average annual rate of revenue growth of residential renovation and design companies in the United States from 2014 to 2019, by firm type
Share this statistic
You have no right to use this feature.
Make sure to contact us if you are interested in scientific citation.
You can upgrade your account to enable this functionality for all statistics.
This feature is not available with your current account.Request access
Participating in the survey were 495 architects; 561 interior and building designers; 599 general contractors / remodelers / builders; 601 design-build firms; 425 building / renovation specialty firms; 182 landscape / outdoor specialty firms; and 231 decorating specialty firms.
The source does not state the survey method.
Learn more about how Statista can support your business.
Houzz. (February 19, 2020). Average annual rate of revenue growth of residential renovation and design companies in the United States from 2014 to 2019, by firm type [Graph]. In Statista. Retrieved February 17, 2025, from https://www.statista.com/statistics/918329/residential-renovation-and-design-us-average-annual-revenue-growth-by-type/
Houzz. "Average annual rate of revenue growth of residential renovation and design companies in the United States from 2014 to 2019, by firm type." Chart. February 19, 2020. Statista. Accessed February 17, 2025. https://www.statista.com/statistics/918329/residential-renovation-and-design-us-average-annual-revenue-growth-by-type/
Houzz. (2020). Average annual rate of revenue growth of residential renovation and design companies in the United States from 2014 to 2019, by firm type. Statista. Statista Inc.. Accessed: February 17, 2025. https://www.statista.com/statistics/918329/residential-renovation-and-design-us-average-annual-revenue-growth-by-type/
Houzz. "Average Annual Rate of Revenue Growth of Residential Renovation and Design Companies in The United States from 2014 to 2019, by Firm Type." Statista, Statista Inc., 19 Feb 2020, https://www.statista.com/statistics/918329/residential-renovation-and-design-us-average-annual-revenue-growth-by-type/
Houzz, Average annual rate of revenue growth of residential renovation and design companies in the United States from 2014 to 2019, by firm type Statista, https://www.statista.com/statistics/918329/residential-renovation-and-design-us-average-annual-revenue-growth-by-type/ (last visited February 17, 2025)
Average annual rate of revenue growth of residential renovation and design companies in the United States from 2014 to 2019, by firm type [Graph], Houzz, February 19, 2020. [Online]. Available: https://www.statista.com/statistics/918329/residential-renovation-and-design-us-average-annual-revenue-growth-by-type/
Profit from additional features with an Employee Account
Please create an employee account to be able to mark statistics as favorites.
Then you can access your favorite statistics via the star in the header.
Profit from the additional features of your individual account
Currently, you are using a shared account. To use individual functions (e.g., mark statistics as favourites, set
statistic alerts) please log in with your personal account.
If you are an admin, please authenticate by logging in again.