This statistic depicts the year-on-year sales growth of the fashion e-commerce industry in Australia in 2017, broken down by category. In that year, the online sales in the women's fashion category increased by 43.8 percent compared to the previous year.
Year-on-year sales growth of the fashion e-commerce industry in Australia in 2017, by category
Basic Account
Get to know the platform
You only have access to basic statistics.
This statistic is not included in your account.
Starter Account
The ideal entry-level account for individual users
- Instant access to 1m statistics
- Download in XLS, PDF & PNG format
- Detailed references
$199 USD / Month *
Professional Account
Full access
Business Solutions including all features.
* Prices do not include sales tax.
Other statistics that may interest you Statistics on
About the industry
10
- Premium Statistic 
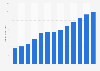
Annual sales growth of clothing e-commerce Australia 2021, by state
- Premium Statistic Sales growth of e-commerce Australia 2023, by category
- Premium Statistic Annual growth of online variety stores in Australia 2017 by type
- Premium Statistic Annual growth of home & garden e-commerce Australia 2021, by state
- Premium Statistic Annual growth of online recreational goods market in Australia 2021, by state
- Premium Statistic Annual growth of online specialty food and liquor market in Australia 2021, by state
- Premium Statistic Annual growth of online variety stores in Australia 2021, by state
- Premium Statistic Annual growth of the online health & beauty market in Australia 2021, by state
- Premium Statistic Sales share of e-commerce Australia 2022, by category
- Premium Statistic Annual sales growth of e-commerce Australia 2023, by state
About the region
10
- Premium Statistic Market value of B2C e-commerce in Australia 2017-2019
- Premium Statistic Market value of mobile commerce in Australia 2019-2023
- Premium Statistic Distribution of online spending Australia 2024, by category
- Premium Statistic Online grocery expenditure Australia 2024, by market
- Premium Statistic Annual growth in online retail spending Australia 2024, by category
- Premium Statistic Share of online payment methods used Australia 2023, by brand
- Premium Statistic Share of domestic and international online retail spend Australia 2017 by category
- Premium Statistic Leading online mass merchandiser sites Australia 2017, by unique audience
- Premium Statistic What shoppers intent to buy from Amazon Australia 2017
- Premium Statistic Amazon's potential 5-year impact on retailers' earnings Australia 2017 by retailer
Selected statistics
1
Other regions
10
- Premium Statistic Leading B2C e-commerce retailers in China 2010-2011, ranked by order growth rate
- Premium Statistic Age distribution of the eMAG application users in Hungary in 2018
- Premium Statistic Main cross-border online shopping origin markets in Denmark 2022, by market share
- Premium Statistic Reasons for shopping on foreign online shops in Finland 2019
- Premium Statistic Germany: B2C e-commerce sales 2017-2023
- Premium Statistic Leading countries from which consumers purchase online in Norway 2020
- Premium Statistic Foreign webshops used by consumers in Sweden 2019, by country
- Premium Statistic Revenue of the online commerce and mail order business in Switzerland 2008-2019
- Basic Statistic Weekly trend in online orders in fashion & accessories retail sector in Italy 2020
- Premium Statistic U.S. generations shopping online and offline 2021
Related statistics
10
- Premium Statistic Online spending growth New Zealand 2018, by sector
- Premium Statistic Amazon's potential 3-5-year impact on retailers' sales Australia 2017 by sector
- Premium Statistic Share of cross-border e-commerce purchases New Zealand 2016 by category
- Premium Statistic Distribution of online payment methods in New Zealand 2016
- Premium Statistic Leading Australian eBay sellers by number of feedbacks 2017
- Premium Statistic Online groceries and liquor expenditure Australia 2016, by age group
- Premium Statistic Small online retailers distribution of online spending Australia 2016, by category
- Premium Statistic Revenue of online sales of goods and services in Australia 2012-2016
- Premium Statistic Australia: digital buyer penetration 2013-2018
- Premium Statistic Payment methods for e-commerce transactions Australia 2022, by type
Further related statistics
10
- Consumer electronics: Online purchasing in Great Britain 2020, by demographic
- Victoria's Secret's net sales worldwide from 2010 to 2023
- Leading online retailers in Southeast Asia 2020, by monthly visits
- Women's home magazines ranked by circulation change in the UK 2019
- Change in number of visitors from Mexico to the U.S. 2018-2024
- Unique visitors to most popular online retailers in India 2014
- Resources shoppers use most often to make purchase decisions in the UK 2013
- Store number growth of the leading 100 retailers in China 2010-2012, by city tier
- Profit margin of supermarket and hypermarket companies in China 2011-2012, by origin
- U.S. chemical industry - output projections 2008-2014
Further Content: You might find this interesting as well
Statistics
- Consumer electronics: Online purchasing in Great Britain 2020, by demographic
- Victoria's Secret's net sales worldwide from 2010 to 2023
- Leading online retailers in Southeast Asia 2020, by monthly visits
- Women's home magazines ranked by circulation change in the UK 2019
- Change in number of visitors from Mexico to the U.S. 2018-2024
- Unique visitors to most popular online retailers in India 2014
- Resources shoppers use most often to make purchase decisions in the UK 2013
- Store number growth of the leading 100 retailers in China 2010-2012, by city tier
- Profit margin of supermarket and hypermarket companies in China 2011-2012, by origin
- U.S. chemical industry - output projections 2008-2014
Australia Post. (May 28, 2018). Year-on-year sales growth of the fashion e-commerce industry in Australia in 2017, by category [Graph]. In Statista. Retrieved May 11, 2024, from https://www.statista.com/statistics/905203/australia-fashion-online-sales-growth-by-category/
Australia Post. "Year-on-year sales growth of the fashion e-commerce industry in Australia in 2017, by category." Chart. May 28, 2018. Statista. Accessed May 11, 2024. https://www.statista.com/statistics/905203/australia-fashion-online-sales-growth-by-category/
Australia Post. (2018). Year-on-year sales growth of the fashion e-commerce industry in Australia in 2017, by category. Statista. Statista Inc.. Accessed: May 11, 2024. https://www.statista.com/statistics/905203/australia-fashion-online-sales-growth-by-category/
Australia Post. "Year-on-year Sales Growth of The Fashion E-commerce Industry in Australia in 2017, by Category." Statista, Statista Inc., 28 May 2018, https://www.statista.com/statistics/905203/australia-fashion-online-sales-growth-by-category/
Australia Post, Year-on-year sales growth of the fashion e-commerce industry in Australia in 2017, by category Statista, https://www.statista.com/statistics/905203/australia-fashion-online-sales-growth-by-category/ (last visited May 11, 2024)
Year-on-year sales growth of the fashion e-commerce industry in Australia in 2017, by category [Graph], Australia Post, May 28, 2018. [Online]. Available: https://www.statista.com/statistics/905203/australia-fashion-online-sales-growth-by-category/