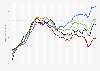
This statistic represents the annual growth of the household final consumption expenditure in Argentina from 2010 to 2016. In 2016, Argentina's private household final consumption expenditure decreased by 1.44 percent.
Growth of household final consumption expenditure in Argentina from 2010 to 2016
Basic Account
Get to know the platform
You only have access to basic statistics.
This statistic is not included in your account.
Starter Account
The ideal entry-level account for individual users
- Instant access to 1m statistics
- Download in XLS, PDF & PNG format
- Detailed references
$199 USD / Month *
Professional Account
Full access
Business Solutions including all features.
* Prices do not include sales tax.
Other statistics that may interest you Statistics on
About the industry
10
- Premium Statistic Argentina: value of household consumption expenditure 2012-2022
- Premium Statistic Latin America and the Caribbean: value of household consumption expenditure 2016
- Premium Statistic Consumer spending on catering services in Poland 2010-2022
- Premium Statistic FMCG spending distribution in Russia 2021, by product category
- Premium Statistic Food and beverages sales distribution in Sweden 2017, by segment
- Premium Statistic Private consumption expenditure on alcoholic beverages in Finland 2012-2022
- Premium Statistic Average spending of residents in Shenzhen 2022, China, by category
- Premium Statistic Consumer spending on semi-durable goods in Poland 2008-2022
- Premium Statistic Consumer spending on non-durable goods in Poland 2008-2022
- Basic Statistic Share of monthly household expenditures spent on food products in France 2018-2022
About the region
10
- Premium Statistic Argentina: annual growth of CPI 2009-2023
- Premium Statistic Retail e-commerce revenue growth in Argentina 2022-2029, by category
- Basic Statistic Gross domestic product (GDP) growth rate in Argentina 2029
- Premium Statistic Export of commodities from Argentina 2022
- Premium Statistic Import of commodities to Argentina 2022
- Premium Statistic Per capita pharma spending 2012-2021
- Premium Statistic Real alcohol & tobacco consumer spending per capita in Latin America and the Caribbean 2020, by country
- Premium Statistic Real alcohol & tobacco consumer spending in Latin America and the Caribbean 2020, by country
- Premium Statistic Real fashion consumer spending in Latin America and the Caribbean 2020, by country
- Premium Statistic Food & beverages consumer spending in Latin America and the Caribbean 2020, by country
Other regions
10
- Premium Statistic Spending on housing, water, electricity, gas and other fuels in Poland 2010-2022
- Premium Statistic UK: share of adults who buy more seasonal & local groceries in 2019/2020, by gender
- Basic Statistic Monthly household expenditures on consumer goods France 2019-2022, by category
- Premium Statistic Monthly household budget for a family of four Luxembourg 2016
- Premium Statistic Retail share of private consumption in the Nordic countries 2018
- Premium Statistic Share of in home and out of home spending on soft drinks in Vietnam 2019, by type
- Premium Statistic Share of private consumption expenditure on services across India FY 2012-2016
- Premium Statistic Share of out of home spending on non-alcoholic drinks in APAC 2018
- Premium Statistic Amazon share of consumer retail spending in the U.S. in 2020, by race and ethnicity
- Premium Statistic Change of household consumption expenditure on food and drinks in Norway 2012-2022
Related statistics
10
- Basic Statistic Mexico: monthly unemployment rate 2019-2023
- Premium Statistic Brazil: share of consumer expenditure by age and category 2018
- Premium Statistic Chile: household expenditure per category 2016
- Premium Statistic Annual final consumption expenditure in Spain 2008-2023
- Premium Statistic Chile: household consumption expenditure 2012-2022
- Premium Statistic Household consumption spending as a share of Spanish GDP 2005-2021
- Premium Statistic Public administration, education and healthcare as a share of Spanish GDP 2005-2021
- Premium Statistic Largest companies in Mexico 2022, by revenue
- Premium Statistic Brazil: growth rate of franchise sector's revenue 2015-2023
- Premium Statistic Paraguay: private consumption expenditure 2015-2018
Further related statistics
10
- Consumer expenditure on video and audio equipment in the U.S. 1999-2019
- Under Armour's operating income worldwide 2008-2023
- Mondelez International's net revenue distribution worldwide by sector 2022
- Mondelez International's operating income worldwide 2011-2022
- Mondelez International's global workforce by region 2012-2022
- Victoria's Secret's net sales worldwide from 2010 to 2023
- Net income of Church & Dwight worldwide 2009-2023
- Iron ore prices 2000-2022
- Secondhand goods: Sales volume percentage change in Great Britain (UK) 2013-2023
- Walgreens gross profit and net earnings in the U.S. 2005-2023
Further Content: You might find this interesting as well
Statistics
- Consumer expenditure on video and audio equipment in the U.S. 1999-2019
- Under Armour's operating income worldwide 2008-2023
- Mondelez International's net revenue distribution worldwide by sector 2022
- Mondelez International's operating income worldwide 2011-2022
- Mondelez International's global workforce by region 2012-2022
- Victoria's Secret's net sales worldwide from 2010 to 2023
- Net income of Church & Dwight worldwide 2009-2023
- Iron ore prices 2000-2022
- Secondhand goods: Sales volume percentage change in Great Britain (UK) 2013-2023
- Walgreens gross profit and net earnings in the U.S. 2005-2023
Index Mundi. (January 23, 2018). Growth of household final consumption expenditure in Argentina from 2010 to 2016 [Graph]. In Statista. Retrieved May 21, 2024, from https://www.statista.com/statistics/899192/argentina-household-final-consumption-expenditure-growth/
Index Mundi. "Growth of household final consumption expenditure in Argentina from 2010 to 2016." Chart. January 23, 2018. Statista. Accessed May 21, 2024. https://www.statista.com/statistics/899192/argentina-household-final-consumption-expenditure-growth/
Index Mundi. (2018). Growth of household final consumption expenditure in Argentina from 2010 to 2016. Statista. Statista Inc.. Accessed: May 21, 2024. https://www.statista.com/statistics/899192/argentina-household-final-consumption-expenditure-growth/
Index Mundi. "Growth of Household Final Consumption Expenditure in Argentina from 2010 to 2016." Statista, Statista Inc., 23 Jan 2018, https://www.statista.com/statistics/899192/argentina-household-final-consumption-expenditure-growth/
Index Mundi, Growth of household final consumption expenditure in Argentina from 2010 to 2016 Statista, https://www.statista.com/statistics/899192/argentina-household-final-consumption-expenditure-growth/ (last visited May 21, 2024)
Growth of household final consumption expenditure in Argentina from 2010 to 2016 [Graph], Index Mundi, January 23, 2018. [Online]. Available: https://www.statista.com/statistics/899192/argentina-household-final-consumption-expenditure-growth/