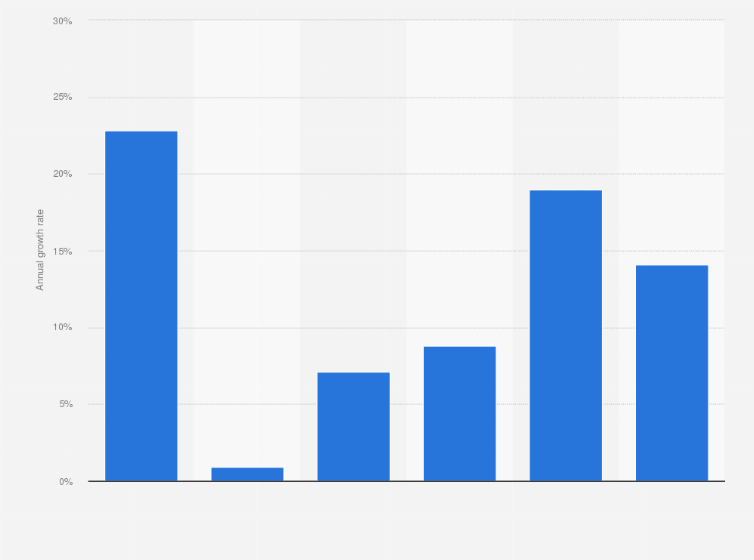
This statistic shows the revenue growth of China's online shopping guide sector from 2016 to 2019 with forecasts up till 2021. In 2019, China's online shopping guide market grew by 14.1 percent from the previous year.
Revenue growth of China's online shopping guide sector from 2016 to 2019 with estimates until 2021
Adjust the presentation of the statistic and data points.
Share the statistic on social media channels or embed the statistic in your
website using "Embed Code", where available.
Cite this statistic and select one of the following formats: APA, Chicago, Harvard, MLA & Bluebook.
Print the statistic including description and metadata.
Chart type
Revenue growth of China's online shopping guide sector from 2016 to 2019 with estimates until 2021
Share this statistic
You have no right to use this feature.
Make sure to contact us if you are interested in scientific citation.
You can upgrade your account to enable this functionality for all statistics.
This feature is not available with your current account.Request access
The data are calculated based on the publicly available materials and interview with companies in iResearch statistical model.
Supplementary notes
*Estimated.
Figures only included revenue from shopping-guide e-commerce websites. Revenue from We Media was not included.
Both horizontal and vertical shopping-guide e-commerce websites were included. .
Revenues for the online shopping-guide services included online shopping, offline shopping guide and/or cashback, hotel and travel booking guide and/or cashback services.
Revenue only included revenue from online shopping guide services and advertisements. The product sales by channels of online shopping guide websites were not included.
Citation formats
Yihan Ma
Research expert covering e-commerce and FMCG in Greater China
Learn more about how Statista can support your business.
iResearch. (August 28, 2020). Revenue growth of China's online shopping guide sector from 2016 to 2019 with estimates until 2021 [Graph]. In Statista. Retrieved April 26, 2025, from https://www.statista.com/statistics/871223/china-revenue-year-on-year-change-in-online-shopping-guide-sector/
iResearch. "Revenue growth of China's online shopping guide sector from 2016 to 2019 with estimates until 2021." Chart. August 28, 2020. Statista. Accessed April 26, 2025. https://www.statista.com/statistics/871223/china-revenue-year-on-year-change-in-online-shopping-guide-sector/
iResearch. (2020). Revenue growth of China's online shopping guide sector from 2016 to 2019 with estimates until 2021. Statista. Statista Inc.. Accessed: April 26, 2025. https://www.statista.com/statistics/871223/china-revenue-year-on-year-change-in-online-shopping-guide-sector/
iResearch. "Revenue Growth of China's Online Shopping Guide Sector from 2016 to 2019 with Estimates until 2021." Statista, Statista Inc., 28 Aug 2020, https://www.statista.com/statistics/871223/china-revenue-year-on-year-change-in-online-shopping-guide-sector/
iResearch, Revenue growth of China's online shopping guide sector from 2016 to 2019 with estimates until 2021 Statista, https://www.statista.com/statistics/871223/china-revenue-year-on-year-change-in-online-shopping-guide-sector/ (last visited April 26, 2025)
Revenue growth of China's online shopping guide sector from 2016 to 2019 with estimates until 2021 [Graph], iResearch, August 28, 2020. [Online]. Available: https://www.statista.com/statistics/871223/china-revenue-year-on-year-change-in-online-shopping-guide-sector/
Profit from additional features with an Employee Account
Please create an employee account to be able to mark statistics as favorites.
Then you can access your favorite statistics via the star in the header.
Profit from the additional features of your individual account
Currently, you are using a shared account. To use individual functions (e.g., mark statistics as favourites, set
statistic alerts) please log in with your personal account.
If you are an admin, please authenticate by logging in again.