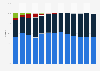
The mobile device market in Australia has been and continues to be dominated by Apple phones; the company has had a comfortable market lead since 2011 with a share always in excess of 50 percent. During the same time period, Samsung phones were the next most popular mobile device choice for Australians; the company have also held a steady share of the market and a clear lead over their next most popular rivals from a variety of manufacturers.
The Australian smartphone market
The number of smartphone users in Australia is gradually increasing year on year, with user numbers expected to reach over 22 million by 2023. Market penetration of smartphones is also increasing gradually and is expected to reach around 86 percent penetration rate by 2023. The majority of Australians across all age groups were smartphone owners.
Adjust the presentation of the statistic and data points.
Share the statistic on social media channels or embed the statistic in your
website using "Embed Code", where available.
Cite this statistic and select one of the following formats: APA, Chicago, Harvard, MLA & Bluebook.
Print the statistic including description and metadata.
Chart type
Market share of leading mobile device vendors in Australia from 2011 to 2023
Share this statistic
You have no right to use this feature.
Make sure to contact us if you are interested in scientific citation.
You can upgrade your account to enable this functionality for all statistics.
This feature is not available with your current account.Request access
Learn more about how Statista can support your business.
StatCounter. (February 9, 2023). Market share of leading mobile device vendors in Australia from 2011 to 2023 [Graph]. In Statista. Retrieved February 21, 2025, from https://www.statista.com/statistics/861577/australia-mobile-device-vendors-market-share/
StatCounter. "Market share of leading mobile device vendors in Australia from 2011 to 2023." Chart. February 9, 2023. Statista. Accessed February 21, 2025. https://www.statista.com/statistics/861577/australia-mobile-device-vendors-market-share/
StatCounter. (2023). Market share of leading mobile device vendors in Australia from 2011 to 2023. Statista. Statista Inc.. Accessed: February 21, 2025. https://www.statista.com/statistics/861577/australia-mobile-device-vendors-market-share/
StatCounter. "Market Share of Leading Mobile Device Vendors in Australia from 2011 to 2023." Statista, Statista Inc., 9 Feb 2023, https://www.statista.com/statistics/861577/australia-mobile-device-vendors-market-share/
StatCounter, Market share of leading mobile device vendors in Australia from 2011 to 2023 Statista, https://www.statista.com/statistics/861577/australia-mobile-device-vendors-market-share/ (last visited February 21, 2025)
Market share of leading mobile device vendors in Australia from 2011 to 2023 [Graph], StatCounter, February 9, 2023. [Online]. Available: https://www.statista.com/statistics/861577/australia-mobile-device-vendors-market-share/
Profit from additional features with an Employee Account
Please create an employee account to be able to mark statistics as favorites.
Then you can access your favorite statistics via the star in the header.
Profit from the additional features of your individual account
Currently, you are using a shared account. To use individual functions (e.g., mark statistics as favourites, set
statistic alerts) please log in with your personal account.
If you are an admin, please authenticate by logging in again.