Most used devices for video games in the Netherlands as of December 2024

Leading companies trust Statista:


Related reports: Available to download in PDF or PPTX format
Gaming market in the Netherlands
Everything on "Gaming market in the Netherlands" in one document: edited and divided into chapters, including detailed references.
Statista has been my savior on several occasions. The site is easy to maneuver and the data is in a format that can go right into a report or presentation.![]()
Marlene Greenfield
Vice President, Hearst Magazines
Other statistics that may interest you Gaming market in the Netherlands
Revenue
3
Users
6
- Premium Statistic Average weekly gaming time in the Netherlands 2006-2016
- Premium Statistic Share of people gaming daily in the Netherlands 2013-2019
- Premium Statistic Gaming frequency among youth in the Netherlands 2016, by gender
- Premium Statistic Share of 12 to 16-year-olds who game daily in the Netherlands 2017, by age
- Premium Statistic Share of youth gaming daily in the Netherlands 2017, by gender and education type
- Premium Statistic Preferred game purchase channels in the Netherlands 2017
Devices
6
- Premium Statistic 
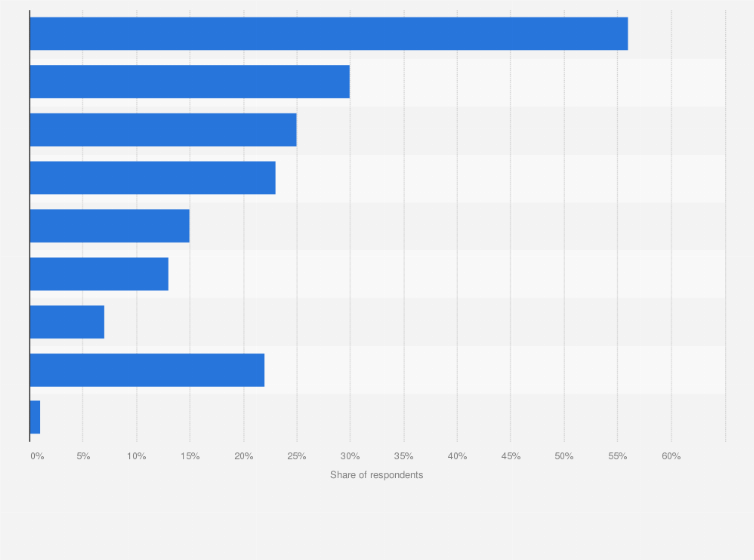
Most used devices for video games in the Netherlands 2024
- Premium Statistic Netherlands console gamers 2024, by age group
- Premium Statistic Share of people with a gaming console in the Netherlands 2014-2018
- Premium Statistic Online gaming on mobile devices in the Netherlands 2016-2017, by age group
- Premium Statistic Online gaming in the Netherlands 2017, by device
- Premium Statistic Frequency of game console usage among children in the Netherlands 2016
Online gaming
8
- Premium Statistic eSports earnings in the Benelux region 2024
- Basic Statistic Leading eSports players in the Netherlands 2024, by prize money earnings
- Premium Statistic Top earners in World of Warcraft in the Netherlands 2024
- Premium Statistic Top earners in Overwatch in the Netherlands 2024
- Premium Statistic Top earners in Counter-Strike: Global Offensive in the Netherlands 2024
- Basic Statistic Monthly Fortnite app revenue in the Netherlands 2018-2019
- Premium Statistic Monthly Pokémon GO app revenue in the Netherlands 2016-2021
- Basic Statistic Leading Twitch streamers in Dutch 2025, by followers
Further related statistics
18
- Most used devices for video games in Indonesia 2024
- Most used devices for video games in Germany 2024
- Most used devices for video games in Sweden 2024
- Most used devices for video games in Mexico 2024
- Most used devices for video games in Canada 2024
- Most used devices for video games in Nigeria 2023
- Most used devices for video games in Austria 2024
- Most used devices for video games in Argentina 2024
- Most used devices for video games in South Korea 2024
- Most used devices for video games in Spain 2024
- Most used devices for video games in Turkey 2024
- China - types of devices used to play games 2016-2018
- Singapore - types of devices used to play games 2017-2018
- India - types of devices used to play games 2016-2018
- Philippines - types of devices used to play games 2017-2018
- Fall Guys MAU on PlayStation 4 worldwide 2020
- Share of internet users who play video games in Romania 2022, by device used
- Video game genre preferences in Romania 2022
Discover Statista
Need help with using Statista for your research?
Tutorials and first steps
Further Content: You might find this interesting as well
Statistics
- Most used devices for video games in Indonesia 2024
- Most used devices for video games in Germany 2024
- Most used devices for video games in Sweden 2024
- Most used devices for video games in Mexico 2024
- Most used devices for video games in Canada 2024
- Most used devices for video games in Nigeria 2023
- Most used devices for video games in Austria 2024
- Most used devices for video games in Argentina 2024
- Most used devices for video games in South Korea 2024
- Most used devices for video games in Spain 2024
- Most used devices for video games in Turkey 2024
- China - types of devices used to play games 2016-2018
- Singapore - types of devices used to play games 2017-2018
- India - types of devices used to play games 2016-2018
- Philippines - types of devices used to play games 2017-2018
- Fall Guys MAU on PlayStation 4 worldwide 2020
- Share of internet users who play video games in Romania 2022, by device used
- Video game genre preferences in Romania 2022
Statista. (January 31, 2025). Most used devices for video games in the Netherlands as of December 2024 [Graph]. In Statista. Retrieved April 15, 2025, from https://www.statista.com/forecasts/825859/most-used-devices-for-video-games-in-the-netherlands
Statista. "Most used devices for video games in the Netherlands as of December 2024." Chart. January 31, 2025. Statista. Accessed April 15, 2025. https://www.statista.com/forecasts/825859/most-used-devices-for-video-games-in-the-netherlands
Statista. (2025). Most used devices for video games in the Netherlands as of December 2024. Statista. Statista Inc.. Accessed: April 15, 2025. https://www.statista.com/forecasts/825859/most-used-devices-for-video-games-in-the-netherlands
Statista. "Most Used Devices for Video Games in The Netherlands as of December 2024." Statista, Statista Inc., 31 Jan 2025, https://www.statista.com/forecasts/825859/most-used-devices-for-video-games-in-the-netherlands
Statista, Most used devices for video games in the Netherlands as of December 2024 Statista, https://www.statista.com/forecasts/825859/most-used-devices-for-video-games-in-the-netherlands (last visited April 15, 2025)
Most used devices for video games in the Netherlands as of December 2024 [Graph], Statista, January 31, 2025. [Online]. Available: https://www.statista.com/forecasts/825859/most-used-devices-for-video-games-in-the-netherlands