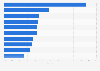
This chart represents the global sales volume of the French PSA Peugeot Citroën Group between 2015 and 2019, by DS model. In 2019 the best-selling DS model was the DS7 Crossback, with around 32,000 cars sold.
Sales volume of the French PSA Peugeot Citroën Group between 2015 and 2019, by DS model
Basic Account
Get to know the platform
You only have access to basic statistics.
This statistic is not included in your account.
Starter Account
The ideal entry-level account for individual users
- Instant access to 1m statistics
- Download in XLS, PDF & PNG format
- Detailed references
$199 USD / Month *
Professional Account
Full access
Business Solutions including all features.
* Prices do not include sales tax.
Other statistics that may interest you Statistics on
About the industry
10
- Premium Statistic Sales revenue of selected French automotive manufacturers 2012-2020
- Premium Statistic Audi's worldwide vehicle shipments 2007-2023
- Premium Statistic Spain: employment in the manufacturing of motor vehicles and trailers 2008-2023
- Premium Statistic Suzuki vehicle imports in Indonesia 2023, by model
- Basic Statistic Entry luxury vehicles: sales by model in the United States 2022
- Basic Statistic Midsize luxury vehicles: sales by model in the United States 2022
- Premium Statistic Spain: production value of the motor vehicle manufacturing sector 2008-2020
- Basic Statistic United States - car growth outlook 2020-2023
- Premium Statistic Employees of the PSA Group and Renault Group worldwide 2012-2020
- Premium Statistic Latin America: sales of cars and commercial vehicles 2010-2022
About the region
9
- Premium Statistic Number of sales points of Renault Group 2017, by market area
- Premium Statistic Total sales volume of the PSA Peugeot Citroën group by brand 2016
- Premium Statistic PSA Peugeot Citroën global sales volume by Peugeot model 2018-2019
- Premium Statistic PSA Peugeot Citroën global sales volume 2018-2019, by Citroën model
- Basic Statistic Motor vehicle sales growth worldwide 2015-2022
- Premium Statistic Annual car sales worldwide 2010-2023, with a forecast for 2024
- Premium Statistic Bentley Motors: sales revenue growth 2009-2022
- Basic Statistic BMW Group: global car shipments 2007-2023
- Premium Statistic Spain: motor vehicle imports by origin 2022-2023
Selected statistics
3
Other regions
10
- Premium Statistic Number of commercial vehicle sales in Morocco 2005-2021
- Premium Statistic Number of commercial vehicle sales in Tunisia 2005-2019
- Premium Statistic Number of commercial vehicle sales in Libya 2005-2017
- Premium Statistic Number of commercial vehicle sales in Algeria 2005-2019
- Basic Statistic Number of registered vehicles in Norway 2020, by type
- Premium Statistic Monthly vehicle inventory alert index: Chinese auto industry 2014-17
- Premium Statistic Sales volume of the PSA Peugeot Citroën group by brand in Europe 2018-2019
- Premium Statistic Number of Kia cars registered in Hong Kong 2019, by year of manufacture
- Basic Statistic Registrations of second-hand cars: age distribution in France 2005-2018
- Premium Statistic U.S. automobile production split by segment 1990-2021
Related statistics
10
- Premium Statistic Number of Mitsubishi cars registered in Hong Kong 2019, by year of manufacture
- Premium Statistic Number of Bentley cars registered in Hong Kong 2019, by year of manufacture
- Premium Statistic Number of Toyota cars registered in Hong Kong 2019, by year of manufacture
- Premium Statistic Number of Lamborghini cars registered in Hong Kong 2019, by year of manufacture
- Premium Statistic Number of Nissan cars registered in Hong Kong 2019, by year of manufacture
- Premium Statistic Number of BMW I cars registered in Hong Kong 2019, by year of manufacture
- Premium Statistic Number of Volkswagen cars registered in Hong Kong 2019, by year of manufacture
- Premium Statistic Number of Peugeot cars registered in Hong Kong 2019, by year of manufacture
- Premium Statistic Number of BYD cars registered in Hong Kong 2019, by year of manufacture
- Premium Statistic Number of Volvo cars registered in Hong Kong 2019, by year of manufacture
Further related statistics
10
- Net sales growth of the leading consumer products companies worldwide 2013
- Footwear retail sales volume trend in Great Britain (UK) 2008-2022
- Net sales of GameStop worldwide 2010-2023, by region
- Net sales of Dick's Sporting Goods U.S. 2006-2023
- Sales share of L'Oréal's global cosmetic branch 2023, by geographic zone
- Syngenta's sales in the crop protection segment worldwide 2013-2022
- Employee count of Fluor Corporation 2008-2022
- MorphoSys' research & development expenditure 2006-2023
- The adidas Group's global footwear production from 2008-2023
- Hugo Boss - EBITDA 2005-2023
Further Content: You might find this interesting as well
Statistics
- Net sales growth of the leading consumer products companies worldwide 2013
- Footwear retail sales volume trend in Great Britain (UK) 2008-2022
- Net sales of GameStop worldwide 2010-2023, by region
- Net sales of Dick's Sporting Goods U.S. 2006-2023
- Sales share of L'Oréal's global cosmetic branch 2023, by geographic zone
- Syngenta's sales in the crop protection segment worldwide 2013-2022
- Employee count of Fluor Corporation 2008-2022
- MorphoSys' research & development expenditure 2006-2023
- The adidas Group's global footwear production from 2008-2023
- Hugo Boss - EBITDA 2005-2023
PSA Peugeot Citroën. (April 3, 2017). Sales volume of the French PSA Peugeot Citroën Group between 2015 and 2019, by DS model [Graph]. In Statista. Retrieved June 05, 2024, from https://www.statista.com/statistics/790183/sales-volume-ds-models-psa-peugeot-citroen/
PSA Peugeot Citroën. "Sales volume of the French PSA Peugeot Citroën Group between 2015 and 2019, by DS model ." Chart. April 3, 2017. Statista. Accessed June 05, 2024. https://www.statista.com/statistics/790183/sales-volume-ds-models-psa-peugeot-citroen/
PSA Peugeot Citroën. (2017). Sales volume of the French PSA Peugeot Citroën Group between 2015 and 2019, by DS model . Statista. Statista Inc.. Accessed: June 05, 2024. https://www.statista.com/statistics/790183/sales-volume-ds-models-psa-peugeot-citroen/
PSA Peugeot Citroën. "Sales Volume of The French Psa Peugeot Citroën Group between 2015 and 2019, by Ds Model ." Statista, Statista Inc., 3 Apr 2017, https://www.statista.com/statistics/790183/sales-volume-ds-models-psa-peugeot-citroen/
PSA Peugeot Citroën, Sales volume of the French PSA Peugeot Citroën Group between 2015 and 2019, by DS model Statista, https://www.statista.com/statistics/790183/sales-volume-ds-models-psa-peugeot-citroen/ (last visited June 05, 2024)
Sales volume of the French PSA Peugeot Citroën Group between 2015 and 2019, by DS model [Graph], PSA Peugeot Citroën, April 3, 2017. [Online]. Available: https://www.statista.com/statistics/790183/sales-volume-ds-models-psa-peugeot-citroen/