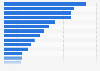
In 2022, Globant generated over 1 billion U.S. dollars in revenue in North America. That year, the company's total revenue exceeded one and a half billion U.S. dollars.
Revenue generated by Globant in 2022, by region
(in million U.S. dollars)
Profit from the additional features of your individual account
Currently, you are using a shared account. To use individual functions (e.g., mark statistics as favourites, set
statistic alerts) please log in with your personal account.
If you are an admin, please authenticate by logging in again.
Learn more about how Statista can support your business.
Globant. (February 28, 2023). Revenue generated by Globant in 2022, by region (in million U.S. dollars) [Graph]. In Statista. Retrieved December 27, 2024, from https://www.statista.com/statistics/787793/globant-revenue-region/
Globant. "Revenue generated by Globant in 2022, by region (in million U.S. dollars)." Chart. February 28, 2023. Statista. Accessed December 27, 2024. https://www.statista.com/statistics/787793/globant-revenue-region/
Globant. (2023). Revenue generated by Globant in 2022, by region (in million U.S. dollars). Statista. Statista Inc.. Accessed: December 27, 2024. https://www.statista.com/statistics/787793/globant-revenue-region/
Globant. "Revenue Generated by Globant in 2022, by Region (in Million U.S. Dollars)." Statista, Statista Inc., 28 Feb 2023, https://www.statista.com/statistics/787793/globant-revenue-region/
Globant, Revenue generated by Globant in 2022, by region (in million U.S. dollars) Statista, https://www.statista.com/statistics/787793/globant-revenue-region/ (last visited December 27, 2024)
Revenue generated by Globant in 2022, by region (in million U.S. dollars) [Graph], Globant, February 28, 2023. [Online]. Available: https://www.statista.com/statistics/787793/globant-revenue-region/