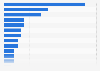
The graph shows weekly time spent with traditional TV in the United States in the first quarter of 2011 and the third quarter of 2018. Time spent watching traditional TV by 18-34-year-olds was estimated at 777 minutes (equivalent to 12 hours and 57 minutes) per week in the third quarter of 2018.
Weekly time spent with traditional TV in the United States in 1st quarter 2011 and 3rd quarter 2018, by age
(in minutes)
Profit from the additional features of your individual account
Currently, you are using a shared account. To use individual functions (e.g., mark statistics as favourites, set
statistic alerts) please log in with your personal account.
If you are an admin, please authenticate by logging in again.
Learn more about how Statista can support your business.
MarketingCharts. (April 3, 2019). Weekly time spent with traditional TV in the United States in 1st quarter 2011 and 3rd quarter 2018, by age (in minutes) [Graph]. In Statista. Retrieved December 19, 2024, from https://www.statista.com/statistics/786371/time-spent-traditional-tv-age/
MarketingCharts. "Weekly time spent with traditional TV in the United States in 1st quarter 2011 and 3rd quarter 2018, by age (in minutes)." Chart. April 3, 2019. Statista. Accessed December 19, 2024. https://www.statista.com/statistics/786371/time-spent-traditional-tv-age/
MarketingCharts. (2019). Weekly time spent with traditional TV in the United States in 1st quarter 2011 and 3rd quarter 2018, by age (in minutes). Statista. Statista Inc.. Accessed: December 19, 2024. https://www.statista.com/statistics/786371/time-spent-traditional-tv-age/
MarketingCharts. "Weekly Time Spent with Traditional Tv in The United States in 1st Quarter 2011 and 3rd Quarter 2018, by Age (in Minutes)." Statista, Statista Inc., 3 Apr 2019, https://www.statista.com/statistics/786371/time-spent-traditional-tv-age/
MarketingCharts, Weekly time spent with traditional TV in the United States in 1st quarter 2011 and 3rd quarter 2018, by age (in minutes) Statista, https://www.statista.com/statistics/786371/time-spent-traditional-tv-age/ (last visited December 19, 2024)
Weekly time spent with traditional TV in the United States in 1st quarter 2011 and 3rd quarter 2018, by age (in minutes) [Graph], MarketingCharts, April 3, 2019. [Online]. Available: https://www.statista.com/statistics/786371/time-spent-traditional-tv-age/