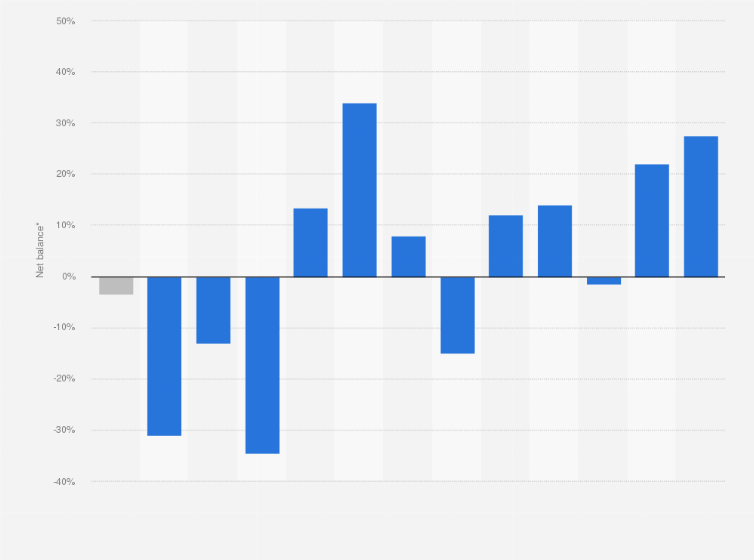
This statistic shows the impression of Chartered Surveyors on the number of newly agreed residential real estate sales in the United Kingdom in 2017, by region. In the UK, numbers on the real estate market are provided once per year through the English Housing Survey, a continuous national survey commissioned by th UK Rese Department for Communities and Local Government (DCLG). For a monthly overview, theidential Market Survey from the Royal Institution of Chartered Surveyors (RICS) is often used. In August 2017, the region of London was deemed to witness a decrease in residential real estate sales with regions further away from the capital being more upbeat.
How have agreed sales changed over the last month? (down/ same/ up)*
monthly sentiment survey of Chartered Surveyos who operate in the residential sales and lettings markets
Method of interview
Panel survey
Supplementary notes
* The numbers provided are a sentiment. The source states that "a positive net balance implies that more respondents are seeing increases than decreases (in the underlying variable), a negative net balance implies that more respondents are seeing decreases than increases and a zero net balance implies an equal number of respondents are seeing increases and decreases. Therefore, a -100 reading implies that no respondents are seeing increases (or no change), and a +100 reading implies that no respondents are seeing decreases (or no change)."
Profit from the additional features of your individual account
Currently, you are using a shared account. To use individual functions (e.g., mark statistics as favourites, set
statistic alerts) please log in with your personal account.
If you are an admin, please authenticate by logging in again.
Learn more about how Statista can support your business.
Statista. (October 11, 2017). How have agreed sales changed over the last month? (down/ same/ up)* [Graph]. In Statista. Retrieved January 06, 2025, from https://www.statista.com/statistics/759685/number-of-newly-agreed-residential-real-estate-sales-in-the-uk-by-region/
Statista. "How have agreed sales changed over the last month? (down/ same/ up)*." Chart. October 11, 2017. Statista. Accessed January 06, 2025. https://www.statista.com/statistics/759685/number-of-newly-agreed-residential-real-estate-sales-in-the-uk-by-region/
Statista. (2017). How have agreed sales changed over the last month? (down/ same/ up)*. Statista. Statista Inc.. Accessed: January 06, 2025. https://www.statista.com/statistics/759685/number-of-newly-agreed-residential-real-estate-sales-in-the-uk-by-region/
Statista. "How Have Agreed Sales Changed over The Last Month? (Down/ Same/ Up)*." Statista, Statista Inc., 11 Oct 2017, https://www.statista.com/statistics/759685/number-of-newly-agreed-residential-real-estate-sales-in-the-uk-by-region/
Statista, How have agreed sales changed over the last month? (down/ same/ up)* Statista, https://www.statista.com/statistics/759685/number-of-newly-agreed-residential-real-estate-sales-in-the-uk-by-region/ (last visited January 06, 2025)
How have agreed sales changed over the last month? (down/ same/ up)* [Graph], Statista, October 11, 2017. [Online]. Available: https://www.statista.com/statistics/759685/number-of-newly-agreed-residential-real-estate-sales-in-the-uk-by-region/