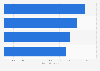
This statistic represents luxury vehicle sales in the United States in 2016, with a breakdown by key segment. In that year, luxury SUV vehicle sales accounted for around 55 percent of total luxury vehicle sales.
Profit from the additional features of your individual account
Currently, you are using a shared account. To use individual functions (e.g., mark statistics as favourites, set
statistic alerts) please log in with your personal account.
If you are an admin, please authenticate by logging in again.
Learn more about how Statista can support your business.
Edmunds . (January 1, 2016). U.S. luxury vehicle sales in 2016, by key segment [Graph]. In Statista. Retrieved December 30, 2024, from https://www.statista.com/statistics/747799/us-luxury-vehicle-sales-by-key-segment/
Edmunds . "U.S. luxury vehicle sales in 2016, by key segment." Chart. January 1, 2016. Statista. Accessed December 30, 2024. https://www.statista.com/statistics/747799/us-luxury-vehicle-sales-by-key-segment/
Edmunds . (2016). U.S. luxury vehicle sales in 2016, by key segment. Statista. Statista Inc.. Accessed: December 30, 2024. https://www.statista.com/statistics/747799/us-luxury-vehicle-sales-by-key-segment/
Edmunds . "U.S. Luxury Vehicle Sales in 2016, by Key Segment." Statista, Statista Inc., 1 Jan 2016, https://www.statista.com/statistics/747799/us-luxury-vehicle-sales-by-key-segment/
Edmunds , U.S. luxury vehicle sales in 2016, by key segment Statista, https://www.statista.com/statistics/747799/us-luxury-vehicle-sales-by-key-segment/ (last visited December 30, 2024)
U.S. luxury vehicle sales in 2016, by key segment [Graph], Edmunds , January 1, 2016. [Online]. Available: https://www.statista.com/statistics/747799/us-luxury-vehicle-sales-by-key-segment/