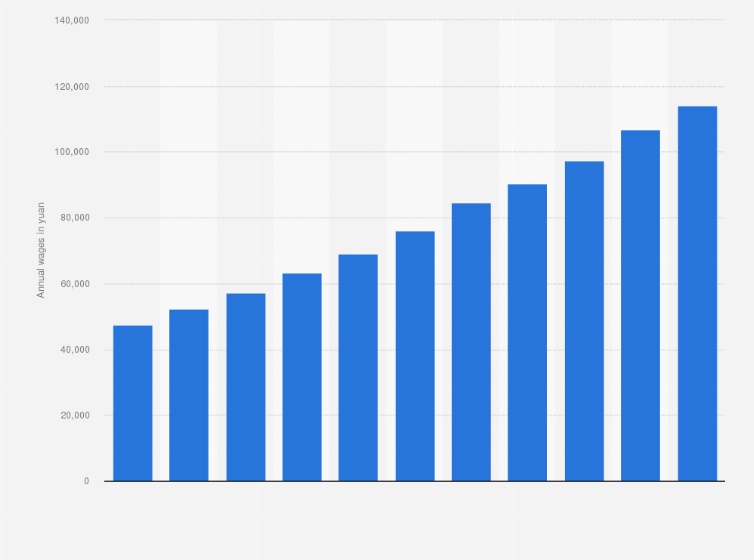
China is the largest labor force market in the world. China’s economic prosperity wouldn’t exist without the large number of people working in this country. With increasing living standards and growing inflation, the wages of employees in China are increasing as well. As of 2022, average wages in China increased to114,029 yuan from 47,593 yuan in 2012.
Wage gap between regions
The wages vary in China depending on sector, position, gender and region like in any other country. Since China’s different regions have developed unequally, the wage gaps between people working in different regions can also be very large. This is a reason for no single minimum wage being set for the entire nation. The local governments set minimum wages based on local living standards. Considering the city tier, the wage standards are higher in cities with higher rankings. Shanghai and Beijing have the highest minimum wage standards in China. Although the minimum wages in China have been increasing, the standards are still lower than in developed countries.
Challenges of increasing labor costs
Increasing wages also make the labor force market less attractive. Affected by increasing labor costs and the China-United States trade war, many companies are transferring their investment destinations, especially in the manufacturing sector. Local governments are also taking measures to ensure the living costs remain at a reasonable level to retain companies and employees. These measures include regulating the residential housing market more strictly.
Average annual wages in China from 2012 to 2022
(in yuan)
Adjust the presentation of the statistic and data points.
Share the statistic on social media channels or embed the statistic in your
website using "Embed Code", where available.
Cite this statistic and select one of the following formats: APA, Chicago, Harvard, MLA & Bluebook.
Print the statistic including description and metadata.
Chart type
Average annual wages in China from 2012 to 2022
Share this statistic
You have no right to use this feature.
Make sure to contact us if you are interested in scientific citation.
You can upgrade your account to enable this functionality for all statistics.
This feature is not available with your current account.Request access
Learn more about how Statista can support your business.
Trading Economics. (December 11, 2023). Average annual wages in China from 2012 to 2022 (in yuan) [Graph]. In Statista. Retrieved April 09, 2025, from https://www.statista.com/statistics/743522/china-average-yearly-wages/
Trading Economics. "Average annual wages in China from 2012 to 2022 (in yuan)." Chart. December 11, 2023. Statista. Accessed April 09, 2025. https://www.statista.com/statistics/743522/china-average-yearly-wages/
Trading Economics. (2023). Average annual wages in China from 2012 to 2022 (in yuan). Statista. Statista Inc.. Accessed: April 09, 2025. https://www.statista.com/statistics/743522/china-average-yearly-wages/
Trading Economics. "Average Annual Wages in China from 2012 to 2022 (in Yuan)." Statista, Statista Inc., 11 Dec 2023, https://www.statista.com/statistics/743522/china-average-yearly-wages/
Trading Economics, Average annual wages in China from 2012 to 2022 (in yuan) Statista, https://www.statista.com/statistics/743522/china-average-yearly-wages/ (last visited April 09, 2025)
Average annual wages in China from 2012 to 2022 (in yuan) [Graph], Trading Economics, December 11, 2023. [Online]. Available: https://www.statista.com/statistics/743522/china-average-yearly-wages/
Profit from additional features with an Employee Account
Please create an employee account to be able to mark statistics as favorites.
Then you can access your favorite statistics via the star in the header.
Profit from the additional features of your individual account
Currently, you are using a shared account. To use individual functions (e.g., mark statistics as favourites, set
statistic alerts) please log in with your personal account.
If you are an admin, please authenticate by logging in again.