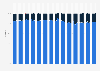
This statistic shows the consumer preference for smartphones over basic cellphones in the United States in 2017 according to a Statista survey. Overall, 95 percent of respondents said that they were likely to buy a smartphone.
Profit from the additional features of your individual account
Currently, you are using a shared account. To use individual functions (e.g., mark statistics as favourites, set
statistic alerts) please log in with your personal account.
If you are an admin, please authenticate by logging in again.
Learn more about how Statista can support your business.
Statista Survey. (April 3, 2017). What kind of cellphone are you likely to get? [Graph]. In Statista. Retrieved March 08, 2025, from https://www.statista.com/statistics/716152/us-consumer-preference-for-smartphones-and-basic-cellphones/
Statista Survey. "What kind of cellphone are you likely to get?." Chart. April 3, 2017. Statista. Accessed March 08, 2025. https://www.statista.com/statistics/716152/us-consumer-preference-for-smartphones-and-basic-cellphones/
Statista Survey. (2017). What kind of cellphone are you likely to get?. Statista. Statista Inc.. Accessed: March 08, 2025. https://www.statista.com/statistics/716152/us-consumer-preference-for-smartphones-and-basic-cellphones/
Statista Survey. "What Kind of Cellphone Are You Likely to Get?." Statista, Statista Inc., 3 Apr 2017, https://www.statista.com/statistics/716152/us-consumer-preference-for-smartphones-and-basic-cellphones/
Statista Survey, What kind of cellphone are you likely to get? Statista, https://www.statista.com/statistics/716152/us-consumer-preference-for-smartphones-and-basic-cellphones/ (last visited March 08, 2025)
What kind of cellphone are you likely to get? [Graph], Statista Survey, April 3, 2017. [Online]. Available: https://www.statista.com/statistics/716152/us-consumer-preference-for-smartphones-and-basic-cellphones/