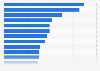
The graph shows the average e-mail spam placement rates worldwide from 2015 to 2018. According to the source, nine percent of commercial e-mails were considered spam by inbox providers in 2018.
Spam placement rate worldwide in 2015 to 2018
Characteristic
Rate
-
-
-
-
-
-
-
-
Exclusive Premium Statistic
To access all Premium Statistics, you need a paid Statista Account
based on 17,000 commercial senders, 2 million consumer panelists and more than 6.9 million commercial e-mail messages sent to Microsoft, Gmail, Yahoo and AOL users in 2018
Profit from the additional features of your individual account
Currently, you are using a shared account. To use individual functions (e.g., mark statistics as favourites, set
statistic alerts) please log in with your personal account.
If you are an admin, please authenticate by logging in again.
Learn more about how Statista can support your business.
Return Path. (March 4, 2019). Spam placement rate worldwide in 2015 to 2018 [Graph]. In Statista. Retrieved July 22, 2024, from https://www.statista.com/statistics/690939/spam-placement-rate/
Return Path. "Spam placement rate worldwide in 2015 to 2018." Chart. March 4, 2019. Statista. Accessed July 22, 2024. https://www.statista.com/statistics/690939/spam-placement-rate/
Return Path. (2019). Spam placement rate worldwide in 2015 to 2018. Statista. Statista Inc.. Accessed: July 22, 2024. https://www.statista.com/statistics/690939/spam-placement-rate/
Return Path. "Spam Placement Rate Worldwide in 2015 to 2018." Statista, Statista Inc., 4 Mar 2019, https://www.statista.com/statistics/690939/spam-placement-rate/
Return Path, Spam placement rate worldwide in 2015 to 2018 Statista, https://www.statista.com/statistics/690939/spam-placement-rate/ (last visited July 22, 2024)
Spam placement rate worldwide in 2015 to 2018 [Graph], Return Path, March 4, 2019. [Online]. Available: https://www.statista.com/statistics/690939/spam-placement-rate/