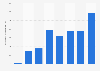
Operating profit Netmarble 2014-2023

Operating profit of Netmarble Corp. from 2014 to 2023

CharacteristicSales in billion South Korean won
2023 -68.47
2022 -108.69
2021 151.03
2020 272.05
2019 202.65
2018 241.65
2017 509.76
2016 294.69
2015 225.35
2014 88.79
Created with Highcharts 7.2.2Sales in billion South Korean won88.7988.79225.35225.35294.69294.69509.76509.76241.65241.65202.65202.65272.05272.05151.03151.03-108.69-108.69-68.47-68.472014201520162017201820192020202120222023
-200-1000100200300400500600
Download
Show detailed source information?
Register for free
Already a member?
Log in
Source

Use Ask Statista Research Service

Release date

October 2024

Region

South Korea

Survey time period

2014 to 2023

Supplementary notes

Figures have been rounded.

1,000 South Korean won equals 0.76 U.S. dollars or 0.68 euros as of October 2024. 

The source did not provide a date of publication. The date used here is the access date.

Citation formats
Access all statistics starting from $2,388 USD yearly *

* For commercial use only

Basic Account

For single users
$0 USD
Always free
Access limited to Free Statistics. Premium Statistics are not included.
  • Free Statistics
Based on your interests

Starter Account

For single users
$199 USD
per month, billed annually 1
  • Free Statistics
  • Premium Statistics

Professional Account

For teams of up to 5 people
$1,299 USD
per month, billed annually 1
  • Free + Premium Statistics
  • Reports
  • Market Insights

1 All prices do not include sales tax. The account requires an annual contract and will renew after one year to the regular list price.

Leading companies trust Statista:
paypal google adobe pg samsung telekom

Related reports: Available to download in PDF or PPTX format

All datain one format
All data
in one format
Mobile gaming market leaders

Everything on "Mobile gaming market leaders" in one document: edited and divided into chapters, including detailed references.

I think of Statista as Google for researchers. Statista provides you with the information you search for right away.
Dr. Horst Stipp

Dr. Horst Stipp
EVP, Research & Innovation, Advertising Research Foundation

Statistics on " Mobile gaming market leaders "

Other statistics that may interest you Mobile gaming market leaders

Global market overview

5

North America

6

Benchmark

6

EMEA

6

Asia

8

Spotlight: China

8

Further related statistics

18

Discover Statista

Need help with using Statista for your research? Tutorials and first steps
Do you have any questions about our business solutions?

We provide you with detailed information about our Professional Account.

All features, all contents, at all times: Learn more about our professional solutions.

* For commercial use only

Basic Account

For single users
$0 USD
Always free
Access limited to Free Statistics. Premium Statistics are not included.
  • Free Statistics
Based on your interests

Starter Account

For single users
$199 USD
per month, billed annually 1
  • Free Statistics
  • Premium Statistics

Professional Account

For teams of up to 5 people
$1,299 USD
per month, billed annually 1
  • Free + Premium Statistics
  • Reports
  • Market Insights

1 All prices do not include sales tax. The account requires an annual contract and will renew after one year to the regular list price.

Learn more about how Statista can support your business.