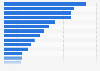
The statistic shows the distribution of time taken to deploy new software builds, both as it typically is and how developers would like it to be, as of early 2018, based on a survey of development professionals. According to the survey, 16 percent of respondents indicated they would like to be able to release new software builds every hour.
Frequency of software build deployment worldwide, in 2018, current vs desired
Adjust the presentation of the statistic and data points.
Share the statistic on social media channels or embed the statistic in your
website using "Embed Code", where available.
Cite this statistic and select one of the following formats: APA, Chicago, Harvard, MLA & Bluebook.
Print the statistic including description and metadata.
Chart type
Frequency of software build deployment worldwide, in 2018, current vs desired
Share this statistic
You have no right to use this feature.
Make sure to contact us if you are interested in scientific citation.
You can upgrade your account to enable this functionality for all statistics.
This feature is not available with your current account.Request access
technology professionals responsible for development and testing
Supplementary notes
The question was phrased by the source as follows: "How often does your team TYPICALLY deploy a new build?" and "Ideally, how often would your team LIKE TO deploy a new build?"
Learn more about how Statista can support your business.
Sauce Labs. (February 28, 2018). Frequency of software build deployment worldwide, in 2018, current vs desired [Graph]. In Statista. Retrieved April 10, 2025, from https://www.statista.com/statistics/673403/worldwide-software-development-survey-deployment-frequency/
Sauce Labs. "Frequency of software build deployment worldwide, in 2018, current vs desired." Chart. February 28, 2018. Statista. Accessed April 10, 2025. https://www.statista.com/statistics/673403/worldwide-software-development-survey-deployment-frequency/
Sauce Labs. (2018). Frequency of software build deployment worldwide, in 2018, current vs desired. Statista. Statista Inc.. Accessed: April 10, 2025. https://www.statista.com/statistics/673403/worldwide-software-development-survey-deployment-frequency/
Sauce Labs. "Frequency of Software Build Deployment Worldwide, in 2018, Current Vs Desired." Statista, Statista Inc., 28 Feb 2018, https://www.statista.com/statistics/673403/worldwide-software-development-survey-deployment-frequency/
Sauce Labs, Frequency of software build deployment worldwide, in 2018, current vs desired Statista, https://www.statista.com/statistics/673403/worldwide-software-development-survey-deployment-frequency/ (last visited April 10, 2025)
Frequency of software build deployment worldwide, in 2018, current vs desired [Graph], Sauce Labs, February 28, 2018. [Online]. Available: https://www.statista.com/statistics/673403/worldwide-software-development-survey-deployment-frequency/
Profit from additional features with an Employee Account
Please create an employee account to be able to mark statistics as favorites.
Then you can access your favorite statistics via the star in the header.
Profit from the additional features of your individual account
Currently, you are using a shared account. To use individual functions (e.g., mark statistics as favourites, set
statistic alerts) please log in with your personal account.
If you are an admin, please authenticate by logging in again.