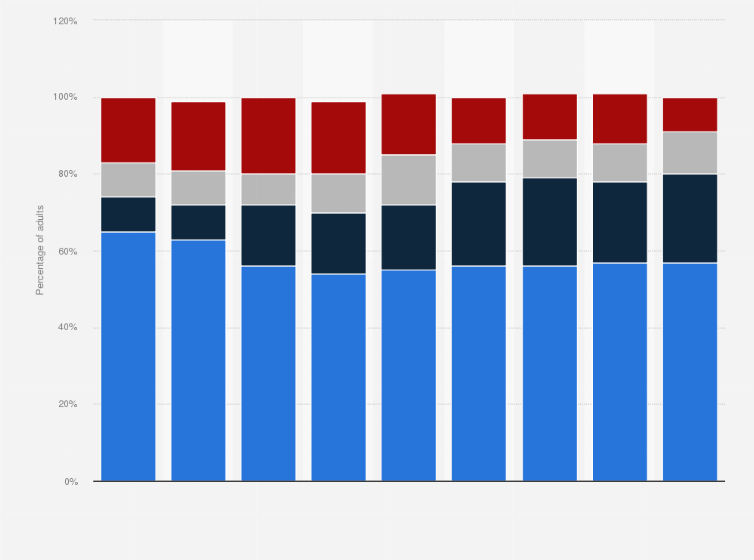
Percentage adults with health insurance in the U.S. 2003-2022

Percentage of health insured vs. uninsured adults in the United States from 2003 to 2022

Download
Show detailed source information?
Register for free
Already a member?
Log in
Sources

Use Ask Statista Research Service

Release date

September 2022

Region

United States

Survey time period

2003 to 2022

Number of respondents

around 4,000-6,000

Age group

19-64 years

Method of interview

Telephone interview

Supplementary notes

Notes: "Uninsured now" refers to adults who reported being uninsured at the time of the survey; "Insured now, had a coverage gap" refers to adults who were insured at the time of survey but had experienced a coverage gap in the past year; "Insured all year, underinsured" refers to adults who were insured for the full year up to and on the survey field date, but had such high out-of pocket costs or deductibles relative to their income that they were effectively underinsured.
Data: Commonwealth Fund Biennial Health Insurance Surveys (2003, 2005, 2010, 2012, 2014, 2016, 2018, 2020, 2022)

Citation formats
Access all statistics starting from $2,388 USD yearly *

* For commercial use only

Basic Account

For single users
$0 USD
Always free
Access limited to Free Statistics. Premium Statistics are not included.
  • Free Statistics
Based on your interest

Starter Account

For single users
$199 USD
per month, billed annually 1
  • Free Statistics
  • Premium Statistics
  • The statistic on this page is a Premium Statistic and is included in this account.

Professional Account

For teams up to 5 people
$959 USD
per month, billed annually 1
  • Free + Premium Statistics
  • Reports
  • Market Insights

1 All prices do not include sales tax. The account requires an annual contract and will renew after one year to the regular list price.

Statistics on " Out-of-pocket health care spending in the U.S. "

Other statistics that may interest you Out-of-pocket health care spending in the U.S.

Health Insurance in the U.S.

5

Cost of insurance

4

Average amount of deductibles and copayments

6

Total out-of-pocket spending in the U.S.

5

Out-of-pocket spending on health care services or specific drugs

7

Miscellaneous

4

Further related statistics

18

Further Content: You might find this interesting as well

Access all statistics starting from $2,388 USD yearly *

* For commercial use only

Basic Account

For single users
$0 USD
Always free
Access limited to Free Statistics. Premium Statistics are not included.
  • Free Statistics
Based on your interest

Starter Account

For single users
$199 USD
per month, billed annually 1
  • Free Statistics
  • Premium Statistics
  • The statistic on this page is a Premium Statistic and is included in this account.

Professional Account

For teams up to 5 people
$959 USD
per month, billed annually 1
  • Free + Premium Statistics
  • Reports
  • Market Insights

1 All prices do not include sales tax. The account requires an annual contract and will renew after one year to the regular list price.

Learn more about how Statista can support your business.