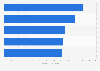
This statistic illustrates the net sales of Aptiv PLC (formerly known as Delphi Automotive) from 2014 to 2017, broken down by region. In 2017, the USA was the manufacturing location, which had generated the most sales at 4.65 billion U.S. dollars. By comparison, manufacturing plants in Europe accounted for 4.24 billion U.S. dollars of total sales.
Aptiv PLC net sales by manufacturing location from 2014 to 2017
(in million U.S. dollars)
Aptiv PLC is a global automotive parts technology company headquartered in the United Kingdom. Prior to December 2017 the company was named Delphi Automotive PLC. Delphi Automotive had spun off its powertrain and aftermarket related business to form stand-alone company Delphi Technologies PLC, while the main company was renamed Aptiv PLC.
* Excluding figures for spin off company Delphi Technologies.
Profit from the additional features of your individual account
Currently, you are using a shared account. To use individual functions (e.g., mark statistics as favourites, set
statistic alerts) please log in with your personal account.
If you are an admin, please authenticate by logging in again.
Learn more about how Statista can support your business.
Aptiv PLC. (February 1, 2018). Aptiv PLC net sales by manufacturing location from 2014 to 2017 (in million U.S. dollars) [Graph]. In Statista. Retrieved October 02, 2024, from https://www.statista.com/statistics/670731/aptiv-plc-sales-by-region/
Aptiv PLC. "Aptiv PLC net sales by manufacturing location from 2014 to 2017 (in million U.S. dollars)." Chart. February 1, 2018. Statista. Accessed October 02, 2024. https://www.statista.com/statistics/670731/aptiv-plc-sales-by-region/
Aptiv PLC. (2018). Aptiv PLC net sales by manufacturing location from 2014 to 2017 (in million U.S. dollars). Statista. Statista Inc.. Accessed: October 02, 2024. https://www.statista.com/statistics/670731/aptiv-plc-sales-by-region/
Aptiv PLC. "Aptiv Plc Net Sales by Manufacturing Location from 2014 to 2017 (in Million U.S. Dollars)." Statista, Statista Inc., 1 Feb 2018, https://www.statista.com/statistics/670731/aptiv-plc-sales-by-region/
Aptiv PLC, Aptiv PLC net sales by manufacturing location from 2014 to 2017 (in million U.S. dollars) Statista, https://www.statista.com/statistics/670731/aptiv-plc-sales-by-region/ (last visited October 02, 2024)
Aptiv PLC net sales by manufacturing location from 2014 to 2017 (in million U.S. dollars) [Graph], Aptiv PLC, February 1, 2018. [Online]. Available: https://www.statista.com/statistics/670731/aptiv-plc-sales-by-region/