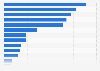
This statistic displays the distribution of pets in the Netherlands in 2016. In 2016, approximately ten percent of the respondents answered they have fish.
Profit from the additional features of your individual account
Currently, you are using a shared account. To use individual functions (e.g., mark statistics as favourites, set
statistic alerts) please log in with your personal account.
If you are an admin, please authenticate by logging in again.
Learn more about how Statista can support your business.
GfK. (May 24, 2016). Distribution of pets in the Netherlands in 2016 [Graph]. In Statista. Retrieved November 21, 2024, from https://www.statista.com/statistics/658729/distribution-of-pets-in-the-netherlands/
GfK. "Distribution of pets in the Netherlands in 2016." Chart. May 24, 2016. Statista. Accessed November 21, 2024. https://www.statista.com/statistics/658729/distribution-of-pets-in-the-netherlands/
GfK. (2016). Distribution of pets in the Netherlands in 2016. Statista. Statista Inc.. Accessed: November 21, 2024. https://www.statista.com/statistics/658729/distribution-of-pets-in-the-netherlands/
GfK. "Distribution of Pets in The Netherlands in 2016." Statista, Statista Inc., 24 May 2016, https://www.statista.com/statistics/658729/distribution-of-pets-in-the-netherlands/
GfK, Distribution of pets in the Netherlands in 2016 Statista, https://www.statista.com/statistics/658729/distribution-of-pets-in-the-netherlands/ (last visited November 21, 2024)
Distribution of pets in the Netherlands in 2016 [Graph], GfK, May 24, 2016. [Online]. Available: https://www.statista.com/statistics/658729/distribution-of-pets-in-the-netherlands/