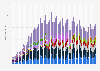
Value of total entertainment expenditure in Bengaluru India 2015
This statistic represents the total expenditure on entertainment across Bengaluru in India in 2015, broken down by zones. Overall, Bengaluru's expenditure on entertainment during the measured time period amounted to approximately 28 billion Indian rupees, a majority of which came from the west zone of the city.