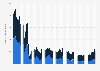
Total number of coupons redeemed in the U.S. 2005-2016
This statistic shows the total number of coupons distributed in the United States from 2005 to 2016. In 2016, the total number of coupons redeemed in the United States was 2.2 billion, down from 2.3 billion in 2015.