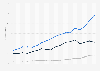
Number of stores of Briscoe Group Limited in New Zealand 2012-2019, by branch type
This statistic displays the number of stores of Briscoe Group Limited in New Zealand from 2012 to 2019, by branch type. In 2019, Briscoe Group Limited had 46 homeware stores and 38 sporting good stores in New Zealand.