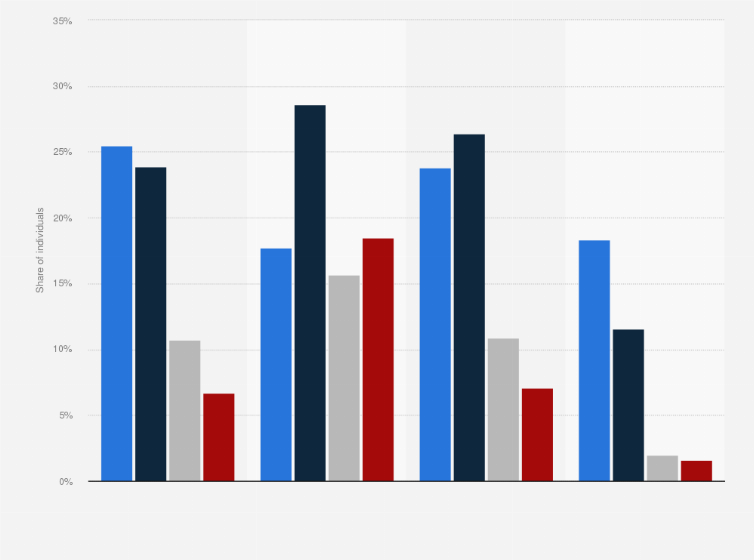
This statistic illustrates the online shopping frequency in the last 3 months by individuals in the Netherlands in 2019, by age group. As of 2019, roughly 16 percent of the Dutch 25 to 45-year-olds bought something online six to ten times in the last three months.
Online shopping frequency in the last 3 months by individuals in the Netherlands in 2019, by age group
Adjust the presentation of the statistic and data points.
Share the statistic on social media channels or embed the statistic in your
website using "Embed Code", where available.
Cite this statistic and select one of the following formats: APA, Chicago, Harvard, MLA & Bluebook.
Print the statistic including description and metadata.
Chart type
Online shopping frequency in the last 3 months by individuals in the Netherlands in 2019, by age group
Share this statistic
You have no right to use this feature.
Make sure to contact us if you are interested in scientific citation.
You can upgrade your account to enable this functionality for all statistics.
This feature is not available with your current account.Request access
not including people in institutions, facilities and shelters
Method of interview
Computer-assisted telephone interviews (CATI)
Supplementary notes
The question was phrased by the source as follows: "How often in the past 3 months have you purchased or ordered goods or services on the internet?"
The source explains: "Online purchases are goods that have been purchased via an internet browser or an app. Goods that were bought via SMS, MMS or e-mail are not included as online purchases."
Learn more about how Statista can support your business.
Centraal Bureau voor de Statistiek. (October 8, 2019). Online shopping frequency in the last 3 months by individuals in the Netherlands in 2019, by age group [Graph]. In Statista. Retrieved May 16, 2025, from https://www.statista.com/statistics/562105/online-shopping-frequency-in-the-last-3-months-in-the-netherlands-by-age-group/
Centraal Bureau voor de Statistiek. "Online shopping frequency in the last 3 months by individuals in the Netherlands in 2019, by age group." Chart. October 8, 2019. Statista. Accessed May 16, 2025. https://www.statista.com/statistics/562105/online-shopping-frequency-in-the-last-3-months-in-the-netherlands-by-age-group/
Centraal Bureau voor de Statistiek. (2019). Online shopping frequency in the last 3 months by individuals in the Netherlands in 2019, by age group. Statista. Statista Inc.. Accessed: May 16, 2025. https://www.statista.com/statistics/562105/online-shopping-frequency-in-the-last-3-months-in-the-netherlands-by-age-group/
Centraal Bureau voor de Statistiek. "Online Shopping Frequency in The Last 3 Months by Individuals in The Netherlands in 2019, by Age Group." Statista, Statista Inc., 8 Oct 2019, https://www.statista.com/statistics/562105/online-shopping-frequency-in-the-last-3-months-in-the-netherlands-by-age-group/
Centraal Bureau voor de Statistiek, Online shopping frequency in the last 3 months by individuals in the Netherlands in 2019, by age group Statista, https://www.statista.com/statistics/562105/online-shopping-frequency-in-the-last-3-months-in-the-netherlands-by-age-group/ (last visited May 16, 2025)
Online shopping frequency in the last 3 months by individuals in the Netherlands in 2019, by age group [Graph], Centraal Bureau voor de Statistiek, October 8, 2019. [Online]. Available: https://www.statista.com/statistics/562105/online-shopping-frequency-in-the-last-3-months-in-the-netherlands-by-age-group/
Profit from additional features with an Employee Account
Please create an employee account to be able to mark statistics as favorites.
Then you can access your favorite statistics via the star in the header.
Profit from the additional features of your individual account
Currently, you are using a shared account. To use individual functions (e.g., mark statistics as favourites, set
statistic alerts) please log in with your personal account.
If you are an admin, please authenticate by logging in again.