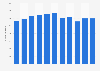
This statistic shows the number of casino visits in Switzerland from 2010 to 2017. In 2010, the number of casino visits in Switzerland amounted to 5.2 million and by 2017 it slowly declined to approximately 4.79 million visits.
Number of casino visits in Switzerland from 2010 to 2017 (in millions)
Basic Account
Get to know the platform
You only have access to basic statistics.
This statistic is not included in your account.
Starter Account
The ideal entry-level account for individual users
- Instant access to 1m statistics
- Download in XLS, PDF & PNG format
- Detailed references
$199 USD / Month *
Professional Account
Full access
Business Solutions including all features.
* Prices do not include sales tax.
Other statistics that may interest you Statistics on
About the industry
10
- Premium Statistic Czech Republic: number of casinos 2013-2017
- Basic Statistic Europe: casino player visits 2016-2017, by country
- Premium Statistic Casino visits in Poland from 2010 to 2017
- Premium Statistic Europe: number of casinos 2016-2017, by country
- Premium Statistic Casino visits in Spain from 2010 to 2017
- Premium Statistic Casino visits in Austria 2013-2017
- Premium Statistic Casino visits in Netherlands 2013-2017
- Premium Statistic Visitors to Jeju Sun Casino in Jeju, South Korea 2012-2022
- Premium Statistic Visitors to KAL Hotel Mega Luck Casino in Jeju, South Korea 2012-2022
- Premium Statistic Visitors to Kangwon Land Casino in Gangwon, South Korea 2012-2022
About the region
10
- Premium Statistic Revenue of casino gaming in Switzerland from 2010 to 2017
- Basic Statistic Net income of the Casino de la Vallée in Italy 2013-2022
- Basic Statistic Switzerland: turnover of accommodation & food service activities industry 2013-2022
- Basic Statistic Number of visitors to the U.S. from Switzerland 2011-2021
- Premium Statistic Number of overnight trips by Swiss residents 2019-2022, by destination
- Premium Statistic Domestic trips taken for personal purpose in Switzerland 2008-2019
- Premium Statistic Average length of stay in hotels in Switzerland 2007-2019
- Premium Statistic Available capacity of hotels in Switzerland 2007-2019
- Premium Statistic Revenue of DER Touristik in Germany 2009-2019
- Premium Statistic Tourism intensity in Switzerland 2008-2018
Selected statistics
5
- Basic Statistic Total assets of MGM Resorts International worldwide 2008-2022
- Premium Statistic Revenue per available room of Las Vegas Sand hotels 2009-2023, by property
- Premium Statistic Casino gaming revenue in Atlantic City 2015
- Premium Statistic Casino gaming: revenue in Russia 2015
- Basic Statistic U.S. racetrack casino markets by gaming revenue 2012
Other regions
10
- Premium Statistic France: number of casinos 2013-2017
- Premium Statistic Germany: number of casinos 2013-2017
- Premium Statistic Gross revenue from different gaming activities in Macao 2022
- Premium Statistic Yalanwan Casino Jeju sales revenue South Korea 2012-2022
- Premium Statistic Casino gaming amount won from gambling in Nevada in the U.S. 2000-2022
- Premium Statistic Revenue of casino gaming in Greece from 2010 to 2017
- Premium Statistic Revenue of casino gaming in the Netherlands from 2010 to 2017
- Premium Statistic Europe: number of casino industry full-time employees 2016-2017, by country
- Premium Statistic Number of betting and online casino licensees in Denmark 2016, by turnover
- Premium Statistic Premium slot machine manufacturers: market share U.S.& Canada Q2 2016
Related statistics
10
- Premium Statistic Casino visits in France 2010-2019
- Premium Statistic Slot machine manufacturers: market share U.S.& Canada Q2 2016
- Premium Statistic Number of gaming machines worldwide 2021, by property type
- Premium Statistic Most common type of gaming establishments worldwide 2021
- Premium Statistic Number of table games worldwide 2018-2021, by property type
- Premium Statistic Regions with the most gaming properties worldwide 2021
- Premium Statistic Number of poker tables worldwide 2018-2021, by property type
- Premium Statistic Regions with the most poker tables worldwide 2018-2021
- Premium Statistic Regions with the most table games worldwide 2018-2021
- Basic Statistic Number of commercial casinos in the U.S. 2005-2022
Further related statistics
10
- Gross gambling yield of the gambling industry in Great Britain 2015-2022, by sector
- Bingo revenue in Great Britain 2009-2022, by type
- Annual revenue of China Tourism Group Duty Free 2013-2023
- Number of Marriott International hotels worldwide 2009-2023
- Number of available rooms in Las Vegas 2000-2022
- Hotel occupancy rate in Las Vegas 2001-2022
- Foreign exchange earnings from tourism in India 2000-2022
- Number of international tourist arrivals in India 2010-2021
- Number of visitors to the U.S. from Russia 2011-2022
- Change in number of visitors from Mexico to the U.S. 2018-2024
Further Content: You might find this interesting as well
Statistics
- Gross gambling yield of the gambling industry in Great Britain 2015-2022, by sector
- Bingo revenue in Great Britain 2009-2022, by type
- Annual revenue of China Tourism Group Duty Free 2013-2023
- Number of Marriott International hotels worldwide 2009-2023
- Number of available rooms in Las Vegas 2000-2022
- Hotel occupancy rate in Las Vegas 2001-2022
- Foreign exchange earnings from tourism in India 2000-2022
- Number of international tourist arrivals in India 2010-2021
- Number of visitors to the U.S. from Russia 2011-2022
- Change in number of visitors from Mexico to the U.S. 2018-2024
European Casino Association. (February 17, 2018). Number of casino visits in Switzerland from 2010 to 2017 (in millions) [Graph]. In Statista. Retrieved May 11, 2024, from https://www.statista.com/statistics/545720/number-of-casino-visits-switzerland/
European Casino Association. "Number of casino visits in Switzerland from 2010 to 2017 (in millions)." Chart. February 17, 2018. Statista. Accessed May 11, 2024. https://www.statista.com/statistics/545720/number-of-casino-visits-switzerland/
European Casino Association. (2018). Number of casino visits in Switzerland from 2010 to 2017 (in millions). Statista. Statista Inc.. Accessed: May 11, 2024. https://www.statista.com/statistics/545720/number-of-casino-visits-switzerland/
European Casino Association. "Number of Casino Visits in Switzerland from 2010 to 2017 (in Millions)." Statista, Statista Inc., 17 Feb 2018, https://www.statista.com/statistics/545720/number-of-casino-visits-switzerland/
European Casino Association, Number of casino visits in Switzerland from 2010 to 2017 (in millions) Statista, https://www.statista.com/statistics/545720/number-of-casino-visits-switzerland/ (last visited May 11, 2024)
Number of casino visits in Switzerland from 2010 to 2017 (in millions) [Graph], European Casino Association, February 17, 2018. [Online]. Available: https://www.statista.com/statistics/545720/number-of-casino-visits-switzerland/