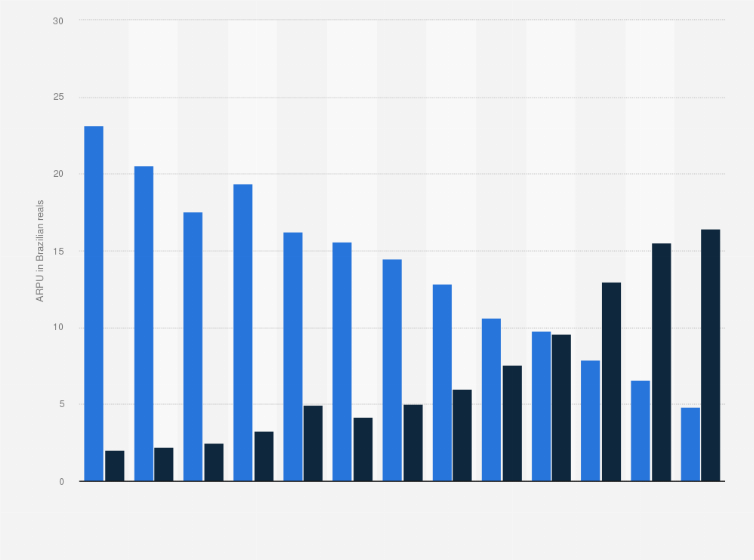
In the first half of 2019, mobile data's monthly average revenue per user (ARPU) in Brazil amounted to 16.42 Brazilian reals. This is nearly 175 percent more than the less than the six real-ARPU recorded five years before, in 2014. Meanwhile, mobile voice's monthly ARPU decreased by 62 percent between 2014 and the first half of 2019, when it added up to 4.85 reals.
Monthly average revenue per user (ARPU) of mobile voice and data services in Brazil from 2007 to 1st half 2019
(in Brazilian reals)
Adjust the presentation of the statistic and data points.
Share the statistic on social media channels or embed the statistic in your
website using "Embed Code", where available.
Cite this statistic and select one of the following formats: APA, Chicago, Harvard, MLA & Bluebook.
Print the statistic including description and metadata.
Chart type
Monthly average revenue per user (ARPU) of mobile voice and data services in Brazil from 2007 to 1st half 2019
Share this statistic
You have no right to use this feature.
Make sure to contact us if you are interested in scientific citation.
You can upgrade your account to enable this functionality for all statistics.
This feature is not available with your current account.Request access
Statista has been my savior on several occasions.
The site is easy to maneuver and the data is in a format that can
go right into a report or presentation.
Learn more about how Statista can support your business.
Telebrasil. (September 16, 2019). Monthly average revenue per user (ARPU) of mobile voice and data services in Brazil from 2007 to 1st half 2019 (in Brazilian reals) [Graph]. In Statista. Retrieved April 28, 2025, from https://www.statista.com/statistics/524011/mobile-voice-and-data-arpu-in-brazil/
Telebrasil. "Monthly average revenue per user (ARPU) of mobile voice and data services in Brazil from 2007 to 1st half 2019 (in Brazilian reals)." Chart. September 16, 2019. Statista. Accessed April 28, 2025. https://www.statista.com/statistics/524011/mobile-voice-and-data-arpu-in-brazil/
Telebrasil. (2019). Monthly average revenue per user (ARPU) of mobile voice and data services in Brazil from 2007 to 1st half 2019 (in Brazilian reals). Statista. Statista Inc.. Accessed: April 28, 2025. https://www.statista.com/statistics/524011/mobile-voice-and-data-arpu-in-brazil/
Telebrasil. "Monthly Average Revenue per User (Arpu) of Mobile Voice and Data Services in Brazil from 2007 to 1st Half 2019 (in Brazilian Reals)." Statista, Statista Inc., 16 Sep 2019, https://www.statista.com/statistics/524011/mobile-voice-and-data-arpu-in-brazil/
Telebrasil, Monthly average revenue per user (ARPU) of mobile voice and data services in Brazil from 2007 to 1st half 2019 (in Brazilian reals) Statista, https://www.statista.com/statistics/524011/mobile-voice-and-data-arpu-in-brazil/ (last visited April 28, 2025)
Monthly average revenue per user (ARPU) of mobile voice and data services in Brazil from 2007 to 1st half 2019 (in Brazilian reals) [Graph], Telebrasil, September 16, 2019. [Online]. Available: https://www.statista.com/statistics/524011/mobile-voice-and-data-arpu-in-brazil/
Profit from additional features with an Employee Account
Please create an employee account to be able to mark statistics as favorites.
Then you can access your favorite statistics via the star in the header.
Profit from the additional features of your individual account
Currently, you are using a shared account. To use individual functions (e.g., mark statistics as favourites, set
statistic alerts) please log in with your personal account.
If you are an admin, please authenticate by logging in again.