This statistic has been taken from the 2015 GfK Roper Reports. It shows the aggregated results of online and in-person surveys conducted in 27 countries around the world in 2015. Participants were asked how often they consumed certain types of non-alcoholic beverages. Some 67 percent of worldwide survey respondents stated that they consumed milk weekly or more often.
GfK Roper Reports Worldwide are designed as a global data and insight service, aiming to provide a longitudinal view on how consumers' everyday lives are changing. Data is collected for more than 20 countries using a standardized framework to provide the possibility of comparing multiple countries.
For further information on the Gfk Roper Reports, contact GfK.
The GfK Group, founded 1934 in Germany, is the fourth largest market research organization in the world, operating in more than 100 countries across the world with over 10,000 employees.
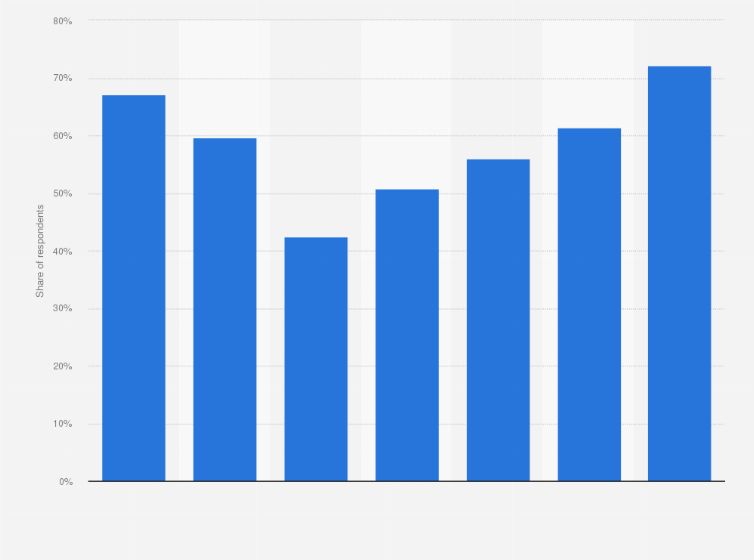
Percentage of consumers worldwide who drink non-alcoholic beverages weekly or more often in 2015, by type of beverage
online data: March 16, 2015 to June 10, 2015; in-person data: March 21, 2015 to May 1, 2015
Number of respondents
32,755 respondents from 27 countries
Age group
15 years and older
Method of interview
Face-to-face interview, online survey
Supplementary notes
This question was phrased by the source as follows: "Please indicate how often you consume the following beverages. Select one answer for each item."
The following countries were part of the survey: Argentina, Australia, Belgium, Brazil, Canada, China, Czechia, Egypt, France, Germany, Hong Kong, India, Indonesia, Italy, Japan, Mexico, Netherlands, Poland, Russia, South Africa, South Korea, Spain, Sweden, Thailand, Turkey, United Kingdom, United States.
Profit from the additional features of your individual account
Currently, you are using a shared account. To use individual functions (e.g., mark statistics as favourites, set
statistic alerts) please log in with your personal account.
If you are an admin, please authenticate by logging in again.
Learn more about how Statista can support your business.
GfK. (August 31, 2015). Percentage of consumers worldwide who drink non-alcoholic beverages weekly or more often in 2015, by type of beverage [Graph]. In Statista. Retrieved November 21, 2024, from https://www.statista.com/statistics/506047/frequency-of-non-alcoholic-beverage-consumption-worldwide/
GfK. "Percentage of consumers worldwide who drink non-alcoholic beverages weekly or more often in 2015, by type of beverage." Chart. August 31, 2015. Statista. Accessed November 21, 2024. https://www.statista.com/statistics/506047/frequency-of-non-alcoholic-beverage-consumption-worldwide/
GfK. (2015). Percentage of consumers worldwide who drink non-alcoholic beverages weekly or more often in 2015, by type of beverage. Statista. Statista Inc.. Accessed: November 21, 2024. https://www.statista.com/statistics/506047/frequency-of-non-alcoholic-beverage-consumption-worldwide/
GfK. "Percentage of Consumers Worldwide Who Drink Non-alcoholic Beverages Weekly or More Often in 2015, by Type of Beverage." Statista, Statista Inc., 31 Aug 2015, https://www.statista.com/statistics/506047/frequency-of-non-alcoholic-beverage-consumption-worldwide/
GfK, Percentage of consumers worldwide who drink non-alcoholic beverages weekly or more often in 2015, by type of beverage Statista, https://www.statista.com/statistics/506047/frequency-of-non-alcoholic-beverage-consumption-worldwide/ (last visited November 21, 2024)
Percentage of consumers worldwide who drink non-alcoholic beverages weekly or more often in 2015, by type of beverage [Graph], GfK, August 31, 2015. [Online]. Available: https://www.statista.com/statistics/506047/frequency-of-non-alcoholic-beverage-consumption-worldwide/