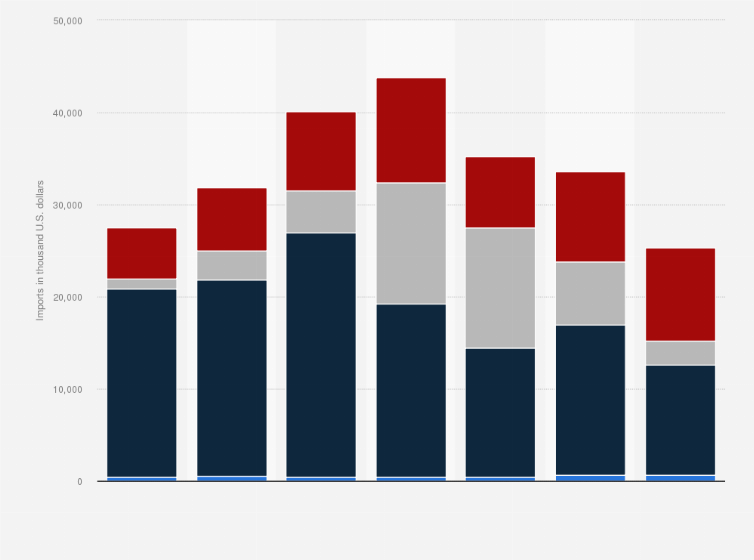
This bar chart illustrates the value of imports of chemicals and related products from Indonesia to the United Kingdom(UK), annually between 2012 and 2018. In 2015, the value of chemicals and related products imported from Indonesia reached 43.8 million U.S. dollars.
Value of imports of chemicals and related products from Indonesia to the United Kingdom (UK) from 2012 to 2018
(in 1,000 U.S. dollars)
Adjust the presentation of the statistic and data points.
Share the statistic on social media channels or embed the statistic in your
website using "Embed Code", where available.
Cite this statistic and select one of the following formats: APA, Chicago, Harvard, MLA & Bluebook.
Print the statistic including description and metadata.
Chart type
Value of imports of chemicals and related products from Indonesia to the United Kingdom (UK) from 2012 to 2018
Share this statistic
You have no right to use this feature.
Make sure to contact us if you are interested in scientific citation.
You can upgrade your account to enable this functionality for all statistics.
This feature is not available with your current account.Request access
Based on Harmonised System 2012: 28 Inorganic chemicals, compounds of precious metals, rare-earth metals etc. Based on Harmonised System 2012: 29 Organic chemicals. Based on Harmonised System 2012: 32 Tanning or dyeing extracts; tannins and their derivatives; dyes, pigments, paints, putty etc. Based on Harmonised System 2012: 33 Essential oils and resinoids, perfumery, cosmetic or toilet preparations. These figures do not include medicinal and pharmaceutical products; Fertilizers; Plastics in primary and non-primary forms and chemical materials and products, n.e.s. Figures have been rounded.
Learn more about how Statista can support your business.
OECD. (March 5, 2019). Value of imports of chemicals and related products from Indonesia to the United Kingdom (UK) from 2012 to 2018 (in 1,000 U.S. dollars) [Graph]. In Statista. Retrieved March 14, 2025, from https://www.statista.com/statistics/497068/indonesia-import-value-of-chemicals-and-products-to-the-uk/
OECD. "Value of imports of chemicals and related products from Indonesia to the United Kingdom (UK) from 2012 to 2018 (in 1,000 U.S. dollars)." Chart. March 5, 2019. Statista. Accessed March 14, 2025. https://www.statista.com/statistics/497068/indonesia-import-value-of-chemicals-and-products-to-the-uk/
OECD. (2019). Value of imports of chemicals and related products from Indonesia to the United Kingdom (UK) from 2012 to 2018 (in 1,000 U.S. dollars). Statista. Statista Inc.. Accessed: March 14, 2025. https://www.statista.com/statistics/497068/indonesia-import-value-of-chemicals-and-products-to-the-uk/
OECD. "Value of Imports of Chemicals and Related Products from Indonesia to The United Kingdom (Uk) from 2012 to 2018 (in 1,000 U.S. Dollars)." Statista, Statista Inc., 5 Mar 2019, https://www.statista.com/statistics/497068/indonesia-import-value-of-chemicals-and-products-to-the-uk/
OECD, Value of imports of chemicals and related products from Indonesia to the United Kingdom (UK) from 2012 to 2018 (in 1,000 U.S. dollars) Statista, https://www.statista.com/statistics/497068/indonesia-import-value-of-chemicals-and-products-to-the-uk/ (last visited March 14, 2025)
Value of imports of chemicals and related products from Indonesia to the United Kingdom (UK) from 2012 to 2018 (in 1,000 U.S. dollars) [Graph], OECD, March 5, 2019. [Online]. Available: https://www.statista.com/statistics/497068/indonesia-import-value-of-chemicals-and-products-to-the-uk/
Profit from additional features with an Employee Account
Please create an employee account to be able to mark statistics as favorites.
Then you can access your favorite statistics via the star in the header.
Profit from the additional features of your individual account
Currently, you are using a shared account. To use individual functions (e.g., mark statistics as favourites, set
statistic alerts) please log in with your personal account.
If you are an admin, please authenticate by logging in again.