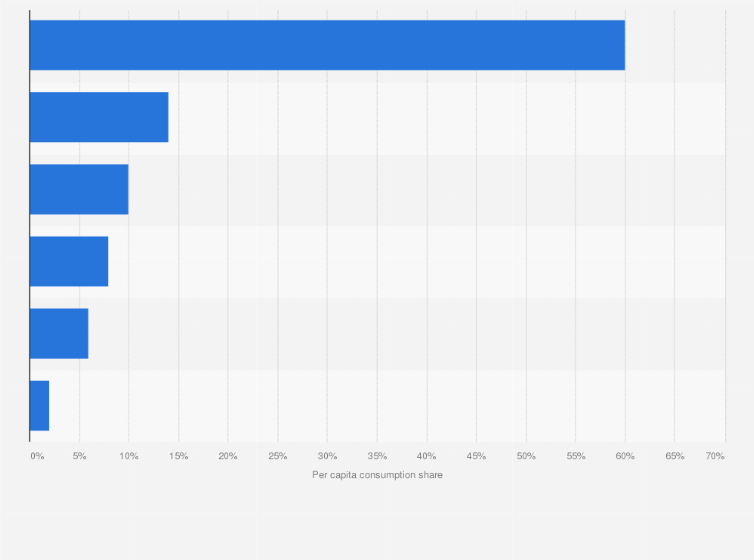
The statistic shows the U.S. at-home per capita consumption share of fruit in 2017, broken down by type. In that year, the at-home per capita consumption share of canned fruit amounted to about 10 percent.
At-home per capita consumption share of fruit in the United States in 2017, by type
Adjust the presentation of the statistic and data points.
Share the statistic on social media channels or embed the statistic in your
website using "Embed Code", where available.
Cite this statistic and select one of the following formats: APA, Chicago, Harvard, MLA & Bluebook.
Print the statistic including description and metadata.
Chart type
At-home per capita consumption share of fruit in the United States in 2017, by type
Share this statistic
You have no right to use this feature.
Make sure to contact us if you are interested in scientific citation.
You can upgrade your account to enable this functionality for all statistics.
This feature is not available with your current account.Request access
Following question was asked: "Regarding Fruit. Thinking only about the food that you prepare at home, what percentage, on average, of these foods are from canned (including glass jars), frozen, fresh, dried, or 100% juice?"
Citation formats
Access all statistics starting from $2,388 USD yearly
*
* For commercial use only
Basic Account
For single users
$0 USD
Always free
Access limited to Free Statistics. Premium Statistics are not included.
Learn more about how Statista can support your business.
US Department of Agriculture, & Economic Research Service, & Produce for Better Health Foundation. (May 5, 2017). At-home per capita consumption share of fruit in the United States in 2017, by type [Graph]. In Statista. Retrieved April 29, 2025, from https://www.statista.com/statistics/477420/us-at-home-per-capita-consumption-share-of-fruit-by-type/
US Department of Agriculture, und Economic Research Service, und Produce for Better Health Foundation. "At-home per capita consumption share of fruit in the United States in 2017, by type." Chart. May 5, 2017. Statista. Accessed April 29, 2025. https://www.statista.com/statistics/477420/us-at-home-per-capita-consumption-share-of-fruit-by-type/
US Department of Agriculture, Economic Research Service, Produce for Better Health Foundation. (2017). At-home per capita consumption share of fruit in the United States in 2017, by type. Statista. Statista Inc.. Accessed: April 29, 2025. https://www.statista.com/statistics/477420/us-at-home-per-capita-consumption-share-of-fruit-by-type/
US Department of Agriculture, and Economic Research Service, and Produce for Better Health Foundation. "At-home per Capita Consumption Share of Fruit in The United States in 2017, by Type." Statista, Statista Inc., 5 May 2017, https://www.statista.com/statistics/477420/us-at-home-per-capita-consumption-share-of-fruit-by-type/
US Department of Agriculture & Economic Research Service & Produce for Better Health Foundation, At-home per capita consumption share of fruit in the United States in 2017, by type Statista, https://www.statista.com/statistics/477420/us-at-home-per-capita-consumption-share-of-fruit-by-type/ (last visited April 29, 2025)
At-home per capita consumption share of fruit in the United States in 2017, by type [Graph], US Department of Agriculture, & Economic Research Service, & Produce for Better Health Foundation, May 5, 2017. [Online]. Available: https://www.statista.com/statistics/477420/us-at-home-per-capita-consumption-share-of-fruit-by-type/
Profit from additional features with an Employee Account
Please create an employee account to be able to mark statistics as favorites.
Then you can access your favorite statistics via the star in the header.
Profit from the additional features of your individual account
Currently, you are using a shared account. To use individual functions (e.g., mark statistics as favourites, set
statistic alerts) please log in with your personal account.
If you are an admin, please authenticate by logging in again.