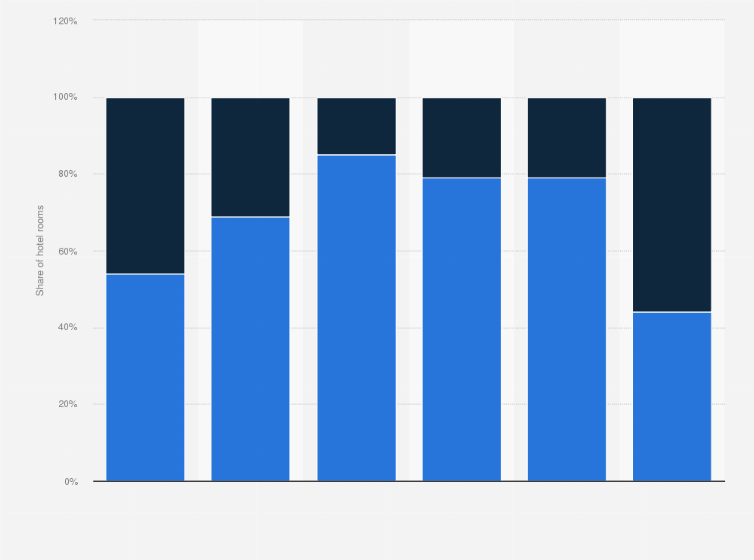
The statistic depicts the share of branded and non-branded hotel rooms worldwide in 2014, by hotel classification. Of economy class hotel rooms worldwide, 54 percent of hotels are branded and 46 percent are not branded.
Share of branded and non-branded hotel rooms worldwide as of December 2014, by hotel classification*
Adjust the presentation of the statistic and data points.
Share the statistic on social media channels or embed the statistic in your
website using "Embed Code", where available.
Cite this statistic and select one of the following formats: APA, Chicago, Harvard, MLA & Bluebook.
Print the statistic including description and metadata.
Chart type
Share of branded and non-branded hotel rooms worldwide as of December 2014, by hotel classification*
Share this statistic
You have no right to use this feature.
Make sure to contact us if you are interested in scientific citation.
You can upgrade your account to enable this functionality for all statistics.
This feature is not available with your current account.Request access
* The class for a chain-affiliated hotel is the same as its chain scale. An independent hotel is assigned a class based on its ADR, relative to that of the chain hotels in its geographic proximity.
Statista has been my savior on several occasions.
The site is easy to maneuver and the data is in a format that can
go right into a report or presentation.
Learn more about how Statista can support your business.
hotelnewsnow.com. (March 26, 2015). Share of branded and non-branded hotel rooms worldwide as of December 2014, by hotel classification* [Graph]. In Statista. Retrieved April 09, 2025, from https://www.statista.com/statistics/472623/branded-non-branded-hotel-classification/
hotelnewsnow.com. "Share of branded and non-branded hotel rooms worldwide as of December 2014, by hotel classification* ." Chart. March 26, 2015. Statista. Accessed April 09, 2025. https://www.statista.com/statistics/472623/branded-non-branded-hotel-classification/
hotelnewsnow.com. (2015). Share of branded and non-branded hotel rooms worldwide as of December 2014, by hotel classification* . Statista. Statista Inc.. Accessed: April 09, 2025. https://www.statista.com/statistics/472623/branded-non-branded-hotel-classification/
hotelnewsnow.com. "Share of Branded and Non-branded Hotel Rooms Worldwide as of December 2014, by Hotel Classification* ." Statista, Statista Inc., 26 Mar 2015, https://www.statista.com/statistics/472623/branded-non-branded-hotel-classification/
hotelnewsnow.com, Share of branded and non-branded hotel rooms worldwide as of December 2014, by hotel classification* Statista, https://www.statista.com/statistics/472623/branded-non-branded-hotel-classification/ (last visited April 09, 2025)
Share of branded and non-branded hotel rooms worldwide as of December 2014, by hotel classification* [Graph], hotelnewsnow.com, March 26, 2015. [Online]. Available: https://www.statista.com/statistics/472623/branded-non-branded-hotel-classification/
Profit from additional features with an Employee Account
Please create an employee account to be able to mark statistics as favorites.
Then you can access your favorite statistics via the star in the header.
Profit from the additional features of your individual account
Currently, you are using a shared account. To use individual functions (e.g., mark statistics as favourites, set
statistic alerts) please log in with your personal account.
If you are an admin, please authenticate by logging in again.