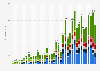
This statistic shows the average weekly retail sales of audio, video and music in household goods store in Great Britain, from January 2017 to October 2023. An average of about 15.6 million British pounds were spent per week on audio, video and music products in October 2023.
Average weekly retail sales of audio, video and music in Great Britain from January 2017 to October 2023
(in million GBP)
Profit from the additional features of your individual account
Currently, you are using a shared account. To use individual functions (e.g., mark statistics as favourites, set
statistic alerts) please log in with your personal account.
If you are an admin, please authenticate by logging in again.
Learn more about how Statista can support your business.
Office for National Statistics (UK). (November 17, 2023). Average weekly retail sales of audio, video and music in Great Britain from January 2017 to October 2023 (in million GBP) [Graph]. In Statista. Retrieved December 21, 2024, from https://www.statista.com/statistics/466982/retail-sales-value-weekly-audio-video-hardware-great-britain/
Office for National Statistics (UK). "Average weekly retail sales of audio, video and music in Great Britain from January 2017 to October 2023 (in million GBP)." Chart. November 17, 2023. Statista. Accessed December 21, 2024. https://www.statista.com/statistics/466982/retail-sales-value-weekly-audio-video-hardware-great-britain/
Office for National Statistics (UK). (2023). Average weekly retail sales of audio, video and music in Great Britain from January 2017 to October 2023 (in million GBP). Statista. Statista Inc.. Accessed: December 21, 2024. https://www.statista.com/statistics/466982/retail-sales-value-weekly-audio-video-hardware-great-britain/
Office for National Statistics (UK). "Average Weekly Retail Sales of Audio, Video and Music in Great Britain from January 2017 to October 2023 (in Million Gbp)." Statista, Statista Inc., 17 Nov 2023, https://www.statista.com/statistics/466982/retail-sales-value-weekly-audio-video-hardware-great-britain/
Office for National Statistics (UK), Average weekly retail sales of audio, video and music in Great Britain from January 2017 to October 2023 (in million GBP) Statista, https://www.statista.com/statistics/466982/retail-sales-value-weekly-audio-video-hardware-great-britain/ (last visited December 21, 2024)
Average weekly retail sales of audio, video and music in Great Britain from January 2017 to October 2023 (in million GBP) [Graph], Office for National Statistics (UK), November 17, 2023. [Online]. Available: https://www.statista.com/statistics/466982/retail-sales-value-weekly-audio-video-hardware-great-britain/